

Overview
Infogram is an AI-assisted tool for infographics, visual reports, and data storytelling. The product page positions it around practical work rather than novelty: users bring in a data point, report outline, presentation brief, or visual story idea and use the tool to move faster from raw input to a usable output.
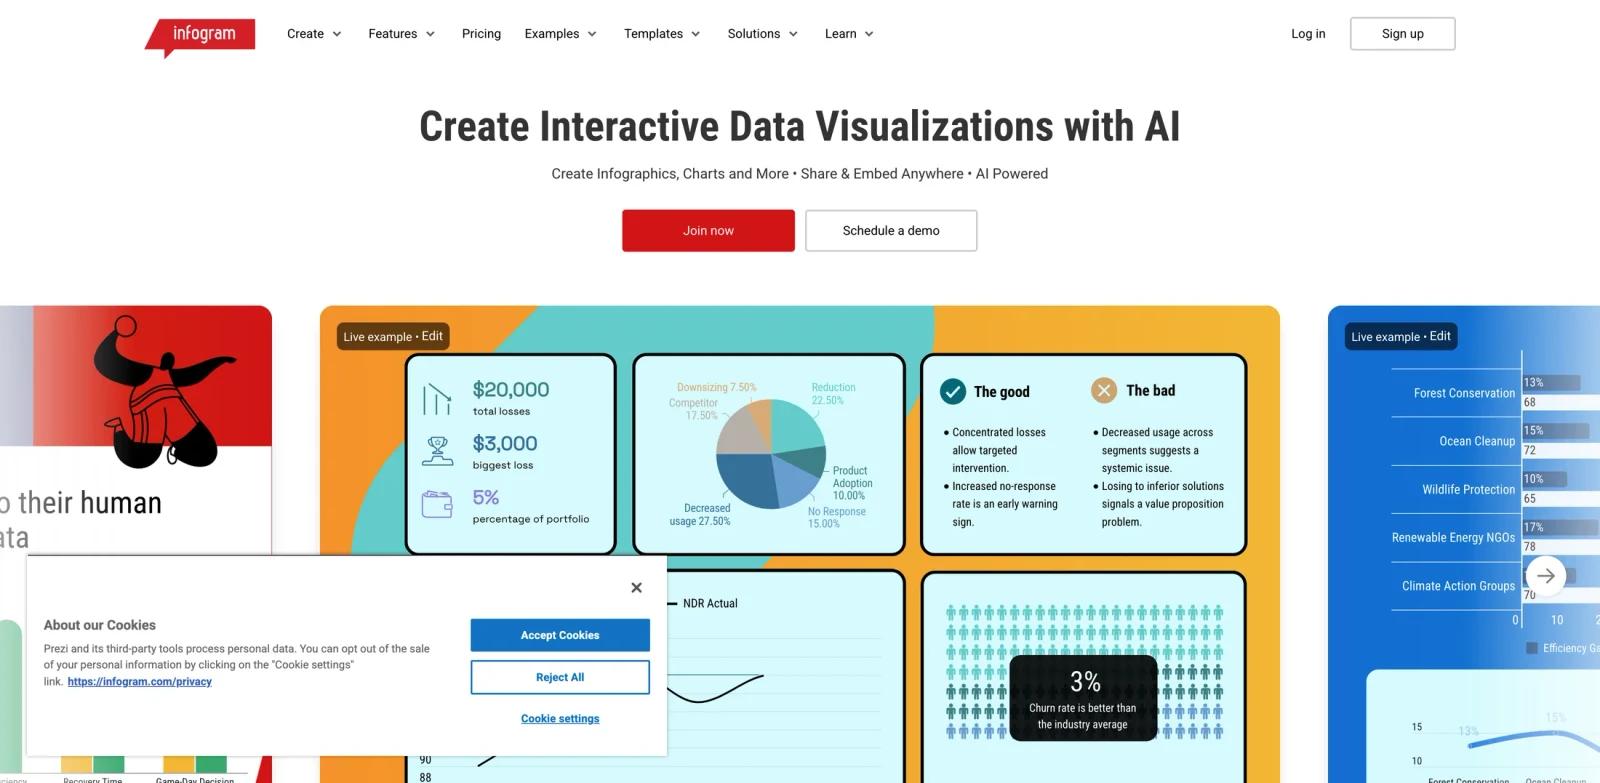
Create interactive charts, maps, infographics, reports and more. Share and embed anywhere. All AI powered from charts to infographics. Visible page signals include "Create Interactive Data Visualizations with AI.", "Empowering Creators Like You.", "Specialized Charts & Maps Library.", which helps buyers evaluate fit against real workflows.
Infogram belongs with AI infographic generator tools and AI data visualization tools. Marketing teams may also compare it with AI graphic design tools when visuals need broader brand production. The strongest fit is a team or individual with a repeatable workflow, clear review standards, and a need to reduce manual setup without handing final judgment to automation.
Key Features
- Visual story creation - Turns data points, ideas, or report content into clearer visual layouts for audiences that scan quickly.
- Template-guided design - Gives non-designers a structured starting point for charts, timelines, comparisons, and explainers.
- Data presentation support - Helps translate numbers or findings into graphics that are easier to discuss and share.
- Brand and format controls - Supports practical output for presentations, social posts, reports, and embedded web content.
- Collaboration-friendly output - Makes it easier for marketing, education, and consulting teams to review and revise visuals together.
How to Get Started
- Open Infogram from the official product page and confirm that the workflow matches the task you want to improve.
- Prepare one realistic input from your current work: a data point, report outline, presentation brief, or visual story idea.
- Run a first output with default settings, then review quality, formatting, factual accuracy, tone, and handoff requirements.
- Test exports, integrations, collaboration settings, and privacy terms before using it for production work.
- Compare the time saved with the review time added. The tool is worth adopting when it reduces repeated work without lowering quality control.
Pricing & Plans
Infogram is best evaluated as a freemium or free-to-start product unless the live pricing page states otherwise. Public pages in this category often highlight a free workflow, while higher usage, exports, collaboration, commercial rights, or brand controls may sit behind paid plans.
| Plan type | What to expect | Best fit |
|---|---|---|
| Free or starter access | Core workflow access with limits on usage, exports, templates, output quality, or advanced controls. | Individuals testing whether the workflow fits. |
| Paid plan | More volume, stronger exports, commercial usage rights, team features, or premium models. | Teams using infographics, visual reports, and data storytelling repeatedly. |
| Business or enterprise | Admin, security, procurement, collaboration, and support terms when available. | Larger teams with governance or scale needs. |
Before buying, confirm current plan limits, export rights, watermark rules, seat pricing, cancellation terms, and whether AI features are included in the advertised plan.
Best For
- marketing teams turning reports into visual assets
- educators explaining complex topics with diagrams and charts
- consultants building client-ready visuals from data points
- social teams repurposing findings into shareable graphics
- Teams comparing multiple tools in this category and needing a practical benchmark before committing budget
FAQ
What is Infogram used for?
Infogram is used for infographics, visual reports, and data storytelling. It helps users turn a prompt, file, draft, conversation, or workflow requirement into a more usable output with less manual setup.
Is Infogram free?
Infogram appears to offer a free or free-to-start path, but plan limits can change. Check the live pricing page for usage caps, export rights, watermark rules, and paid feature thresholds.
Who should consider Infogram?
Consider Infogram if your team handles infographics, visual reports, and data storytelling regularly and the current process is slow, inconsistent, or too dependent on one specialist. Occasional users may still benefit, but the return is clearer when the workflow repeats every week.
What should I test before adopting it?
Test it with a real input from your workflow. Review output quality, editing effort, privacy terms, export formats, collaboration controls, integrations, and whether the result can move cleanly into the next tool your team uses.
How does Infogram compare with general AI chatbots?
General chatbots are flexible, but Infogram provides a more focused workflow for infographics, visual reports, and data storytelling. That focus can reduce setup time, preserve formatting, and make handoff easier when the result needs to be published, shared, or reused.
Can teams use Infogram for client or commercial work?
Many tools in this category support professional use, but licensing and commercial rights vary by plan. Verify usage rights, watermarking, attribution, data handling, and output ownership before using results in client-facing or paid work.
Does Infogram replace human review?
No. It can reduce drafting, planning, analysis, or production time, but users should still review accuracy, tone, formatting, compliance, accessibility, and brand fit before publishing or sending final work.
What are the main risks?
The main risks are over-trusting generated output, misunderstanding plan limits, uploading sensitive data without checking terms, and using first drafts as finished work. A lightweight review checklist solves most of these issues.
What alternatives should I compare?
Compare Infogram with category-specific tools listed in AI infographic generator tools, plus adjacent workflows such as AI data visualization tools and AI graphic design tools. The right choice depends on whether you need speed, control, collaboration, governance, or the strongest final output quality.