
10 Best AI Dashboard Generators 2026 - BI, Agents, and Cost
Building a dashboard is rarely the hard part anymore. The harder question is whether the numbers are trustworthy, whether the dashboard can survive next month's metric change, and whether non-technical teammates can ask follow-up questions without sending every request back to the data team. That is why the best AI dashboard generator in 2026 is not simply the tool that creates the prettiest charts from a prompt. It is the product that turns messy business data into governed, explainable, shareable dashboards with the right balance of speed, permissions, semantic control, and cost.
This guide compares 10 AI dashboard generators across enterprise BI suites, AI-native analytics platforms, warehouse-native tools, and lighter dashboard builders. If your main use case is broader analysis rather than dashboard publishing, start with our AI data analysis tools guide. If you need visual exploration and chart-heavy workflows, our AI data visualization tools category is the adjacent path.
| Tool | Best For |
|---|---|
| Microsoft Power BI | Microsoft-heavy teams that need governed dashboards with Copilot support |
| ThoughtSpot | Business users who want AI search before traditional dashboard building |
| Tableau | Visual analytics teams that need mature BI plus AI assistance |
| Databricks AI/BI | Lakehouse teams that want dashboards without BI seat sprawl |
| Amazon QuickSight | AWS teams that want Q-powered dashboards and embedded analytics |
| Zoho Analytics | SMBs that need low-cost AI-assisted reporting |
| Qlik Sense | Teams that need associative analytics and governed exploration |
| Hex | Data teams publishing notebooks, reports, and apps from one workspace |
| Sigma | Warehouse-native teams that want spreadsheet-like BI and AI apps |
| Databox | Marketing and SaaS teams tracking operating metrics quickly |
How We Selected and Tested
We selected these AI dashboard generators based on a practical definition: the product must help users generate, edit, analyze, or share dashboards with AI assistance. Traditional BI tools were included only when they now offer meaningful AI copilots, natural-language querying, automated insights, or dashboard-generation workflows. Lightweight tools were included only when they connect to real business data and produce shareable dashboards rather than one-off charts.
The research combined current public product pages, pricing pages, help docs, public user-review signals, and the ToolWorthy selection standards. We weighted five factors: functionality, user experience, innovation, value for money, and user feedback. For this category, those factors translate into six buyer questions: Can it connect to the data you already use? Can non-technical users ask questions safely? Does AI respect governed metrics? Are pricing and AI quotas clear? Can dashboards be shared or embedded? How much setup will your data team carry?
Testing scope: We treated public claims conservatively. When pricing was hidden behind sales, the value score was penalized. When AI features depended on a larger ecosystem, such as Microsoft Fabric, AWS, Databricks, or a cloud warehouse, that dependency is called out instead of being treated as free capability. Research was conducted in July 2026 using public information available at the time.
Top 10 AI Dashboard Generators Compared
The market splits into three groups. Power BI, Tableau, Qlik, QuickSight, and Zoho are full BI platforms with AI layered into mature dashboard workflows. ThoughtSpot, Sigma, Hex, and Databricks AI/BI are stronger when the data model or warehouse is already central to the analytics stack. Databox is more focused: it favors fast operating dashboards for marketing, SaaS, and executive KPI tracking.
| Tool | Best For | AI Workflow | Pricing Shape | Main Caveat |
|---|---|---|---|---|
| Microsoft Power BI | Microsoft and Fabric teams | Copilot, DAX help, analysis | From $14/user/month | Best AI value depends on Microsoft stack |
| ThoughtSpot | Search-led analytics | Spotter AI agent | From $25/user/month; Pro from $50/user/month | Spotter query limits affect scale |
| Tableau | Visual analytics teams | Tableau Agent, Pulse | Tableau Next from $40/user/month | Version and licensing complexity |
| Databricks AI/BI | Lakehouse teams | AI/BI Dashboards, Genie | Usage-based Databricks model | Requires Databricks data maturity |
| Amazon QuickSight | AWS teams | Amazon Q in QuickSight | Reader from $3/user/month; Author from $24/user/month; Pro roles from $20/$40/user/month; $250/month infrastructure fee may apply | AWS dependency shapes value |
| Zoho Analytics | SMB reporting | Ask Zia; LLM-powered agent features vary by plan | Free plan; Basic from $24/month billed annually | Less enterprise governance depth |
| Qlik Sense | Associative analytics | Qlik Answers, Insight Advisor, predictive analytics | From $300/month, billed annually | Capacity and packaging are complex |
| Hex | Data teams | AI workspace, apps, reports | Free Community plan; paid from $36/editor/month; Team from $75/editor/month | Less suited to pure business users |
| Sigma | Warehouse-native BI | AI apps and governed insights | Contact sales | Public pricing is limited |
| Databox | KPI monitoring | Genie AI analyst and performance summaries | Free plan; Analyst from $64/month; Pro from $159/month | Narrower than enterprise BI |
Detailed Reviews
Microsoft Power BI
Teams already living in Microsoft 365 often need fewer new tools, not another disconnected dashboard layer. Microsoft Power BI is the strongest AI dashboard generator for organizations that already depend on Excel, Teams, Azure, Fabric, and Microsoft security controls. Its advantage is not only chart creation; it is the ability to bring Copilot, semantic models, DAX help, and enterprise permissions into a familiar BI environment.
Key Features
- Copilot-assisted dashboard work: Power BI Copilot can help summarize data, generate report pages, assist with DAX, and support chat-style analysis when the Microsoft environment is configured correctly.
- Enterprise-grade modeling: Semantic models, row-level security, dataflows, and Fabric integrations make it suitable for governed reporting rather than throwaway dashboards.
- Microsoft ecosystem fit: Teams, Excel, SharePoint, Azure, and Fabric connections reduce adoption friction for companies already standardized on Microsoft.
- Broad visualization and sharing: Reports can serve executives, analysts, managers, and embedded scenarios with a mature permission model.
Pricing & Plans
Power BI includes a Free account for creating reports, while Power BI Pro is publicly priced at about $14/user/month and Premium Per User at about $24/user/month in USD markets. Power BI Embedded is variable, and Copilot usage depends on supported Fabric or Copilot capacity rather than a simple standalone dashboard-builder subscription.
Limitations
The biggest limitation is ecosystem dependency. Power BI is strongest when your data and identity are already in the Microsoft orbit. Teams outside that ecosystem may spend more time on setup, model design, and license planning. It is also not a pure "type one prompt and get a perfect dashboard" tool; governed metrics still need thoughtful modeling.
Best For
Power BI is best for Microsoft-heavy organizations that want AI-assisted BI without replacing their analytics stack. Not the right fit if you need a lightweight dashboard generator for one-off CSV uploads or if your team wants to avoid Microsoft licensing complexity.
Get started with Microsoft Power BI
ThoughtSpot
Many business users do not want to build a dashboard first; they want to ask a question and see whether the answer deserves a dashboard. ThoughtSpot is built around that search-first mindset. Its Spotter AI agent and natural-language analytics make it a strong fit for companies that want governed self-service analytics without pushing every request through a BI developer.
Key Features
- Search-led analytics: Users can ask questions in plain language and move from answers into charts and reusable analysis.
- Spotter AI agent: ThoughtSpot's AI layer is positioned around guided analysis, follow-up questions, and business-user exploration.
- Embedded and cloud options: It works for internal analytics teams and product teams embedding analytics into customer-facing workflows.
- Governed self-service: The product is strongest when data teams prepare reusable models and business users explore inside those guardrails.
Pricing & Plans
ThoughtSpot public pricing lists a user plan starting at $25/user/month, billed annually, and Pro starting at $50/user/month, billed annually. Pro includes Spotter AI Agent with 25 queries/month per user. ThoughtSpot also lists a Developer or embedded evaluation path that is free for 1 year for up to 10 users and 25M rows, while Enterprise and larger embedded deployments are custom-priced. The practical cost depends on AI query volume, user count, data scale, and whether you need embedded analytics. Treat AI quota and consumption rules as a core buying question, not a footnote.
Limitations
ThoughtSpot still depends on a well-modeled data layer. If metric definitions are messy, AI search can expose confusion faster rather than solve it. It can also be more expensive than lightweight dashboard tools for teams that only need a few fixed KPI boards.
Best For
ThoughtSpot is best for organizations that want business users to explore governed data conversationally before asking analysts for new dashboards. Not the right fit if your team mostly needs static executive scorecards or simple marketing dashboards.
Get started with ThoughtSpot
Tableau
Visual analytics teams often choose Tableau because they care deeply about exploration, storytelling, and polished dashboard experiences. Tableau's AI story is now stronger through Tableau Agent and Pulse, which help users create visualizations, monitor metrics, and surface insights. It remains one of the most capable AI dashboard generator choices for teams that already have analytics expertise.
Key Features
- Tableau Agent: Natural-language assistance helps users create and modify visualizations faster inside the Tableau workflow.
- Tableau Pulse: Metric monitoring and proactive insights support business stakeholders who need updates without opening full dashboards every day.
- Mature visualization layer: Tableau remains strong for complex visual exploration, stakeholder storytelling, and dashboard polish.
- Large ecosystem: Training, consultants, community examples, connectors, and enterprise admin patterns are widely available.
Pricing & Plans
Tableau pricing varies by product path, edition, and role. Tableau Cloud Standard is priced by role at $15/user/month for Viewer, $42/user/month for Explorer, and $75/user/month for Creator, billed annually. Tableau Enterprise is $35/user/month for Viewer, $70/user/month for Explorer, and $115/user/month for Creator, billed annually. Tableau Next starts at $40/user/month, billed annually, and Tableau+ Bundle is contact-sales. Every Tableau deployment should be modeled by Viewer, Explorer, Creator, Tableau Next, Tableau Agent, Pulse, Cloud, Server, and embedded needs.
Limitations
Tableau can be more than a small team needs. It rewards trained analysts and thoughtful dashboard design. If your goal is to upload one spreadsheet and get an instant business dashboard, a lighter tool or AI spreadsheet tool may be more efficient.
Best For
Tableau is best for analytics teams that need premium visualization, broad stakeholder reporting, and AI assistance inside a mature BI environment. Not the right fit if cost simplicity and instant setup matter more than visual depth.
Get started with Tableau
Databricks AI/BI
Lakehouse teams have a different problem from spreadsheet teams: the data is already centralized, but BI seat costs, semantic drift, and duplicated dashboards can still slow adoption. Databricks AI/BI is compelling because it brings dashboards and conversational Genie spaces closer to the governed data platform instead of adding another separate BI layer.
Key Features
- AI/BI Dashboards: Teams can build dashboards directly inside the Databricks environment and connect them to governed lakehouse data.
- Genie spaces: Conversational analytics helps users ask questions while staying closer to approved data definitions.
- No separate BI seat mindset: Databricks positions AI/BI around platform usage rather than traditional per-seat BI licensing.
- Strong data-team fit: It works well when engineering, analytics engineering, and governance teams already manage data in Databricks.
Pricing & Plans
Databricks AI/BI does not behave like a simple per-seat dashboard product. Databricks uses usage-based pricing, so the economics depend on workspace usage, SQL compute, DBUs, AI/BI Dashboards, Genie usage, and how much analytics activity moves into Databricks. It can be efficient for existing Databricks customers and awkward for teams that would need to adopt Databricks only for dashboards.
Limitations
This is not the easiest first dashboard generator for a non-technical founder or marketing manager. It assumes data-platform maturity. Business teams may still need curated datasets, semantic definitions, and admin support before AI-assisted dashboards feel self-service.
Best For
Databricks AI/BI is best for companies already standardizing analytics on the Databricks Lakehouse. Not the right fit if your dashboard data lives mostly in spreadsheets, SaaS apps, or a non-Databricks warehouse.
Get started with Databricks AI/BI
Amazon QuickSight
AWS teams often want dashboards that fit inside the rest of their cloud operating model. Amazon QuickSight is the natural candidate when data, identity, billing, and embedded app infrastructure already sit on AWS. With Amazon Q in QuickSight, the product now has a stronger AI dashboard generator story around natural-language BI, dashboard authoring, and executive reporting.
Key Features
- Amazon Q integration: Users can ask questions, build visuals, generate calculations, and explore business data with AI assistance.
- AWS-native scaling: QuickSight works well with Redshift, Athena, S3, RDS, and broader AWS identity and security patterns.
- Embedded analytics: Product teams can embed dashboards and analytics into customer-facing applications.
- Reader economics: Reader and Reader Pro pricing can make broad dashboard consumption more manageable than creator-heavy BI licensing.
Pricing & Plans
Amazon QuickSight pricing includes Reader from $3/user/month, Author from $24/user/month, Reader Pro from $20/user/month, and Author Pro from $40/user/month. AWS also lists Reader capacity pricing, Amazon Q question capacity pricing, and a $250/month per-account infrastructure fee when an account has at least one Pro user, Q&A enabled via topics, or dashboard Q&A enabled. Natural-language dashboard building is tied to Author Pro, while Reader Pro is mainly for consumption-oriented AI features such as executive summaries, generative data stories, and scenarios. The full cost depends on user mix, Q usage, SPICE capacity, embedded use, and AWS data architecture.
Limitations
QuickSight is easiest to justify when AWS is already the center of gravity. Teams on Google Cloud, Microsoft, Snowflake-first workflows, or spreadsheet-heavy operations may find setup less natural than the headline pricing suggests.
Best For
Amazon QuickSight is best for AWS-centric analytics teams that want AI-assisted BI and embedded dashboards. Not the right fit if your organization does not want dashboard decisions tied closely to AWS architecture.
Get started with Amazon QuickSight
Zoho Analytics
Small and mid-sized teams often do not need a heavy enterprise BI rollout. They need a dashboard generator that connects common business apps, explains trends, and stays affordable. Zoho Analytics is strong in that lane because Ask Zia brings AI-assisted analysis into a lower-cost reporting platform that already fits many SMB workflows.
Key Features
- Ask Zia: Zoho's AI assistant supports conversational analytics, report creation, automated insights, and recommendations, but the LLM-powered Ask Zia AI Agent and some advanced GenAI features are plan-dependent, with Premium and Enterprise carrying the fullest AI feature set.
- Business app integrations: Zoho Analytics connects naturally with Zoho apps and many common business data sources.
- Low starting cost: The free plan and paid plans starting around $25/month make it accessible for smaller teams.
- Reports and dashboards together: Users can build dashboards, automate reports, and share views without enterprise BI overhead.
Pricing & Plans
Zoho Analytics is one of the clearer value picks in this list. Public pricing includes an always-free plan and Basic paid plans that start at $24/month when billed annually; Zoho lists the LLM-powered Ask Zia AI Agent, diagnostic insights, and smart recommendations on Premium and Enterprise plans. Buyers should still check users, rows, workspaces, refresh rates, connectors, embedded BI, and which Ask Zia AI features are included in the selected plan.
Limitations
Zoho is not the deepest option for complex enterprise semantic layers, embedded analytics at scale, or highly customized governance. It is better as a pragmatic dashboard tool than as the central analytics architecture for a large company.
Best For
Zoho Analytics is best for SMBs and operators who want useful AI-assisted dashboards without enterprise pricing. Not the right fit if you need deep warehouse-native governance or advanced embedded analytics.
Get started with Zoho Analytics
Qlik Sense
Some teams do not trust dashboards because the first filter hides the second-order relationship they needed to see. Qlik Sense remains relevant because its associative analytics model helps users explore relationships across data, while AI-powered insights and guidance can shorten the path from question to dashboard.
Key Features
- Associative analytics engine: Qlik's core model helps users investigate relationships without being locked into one linear drill path.
- AI-powered insight support: Insight Advisor and related AI features help surface patterns, suggestions, and explanations.
- Governed analytics: Qlik Sense supports enterprise deployment patterns, cloud and on-prem options, and data governance workflows.
- Strong exploration fit: It is useful when users need to investigate why metrics changed, not only view a dashboard.
Pricing & Plans
Qlik Cloud Analytics public pricing starts with Starter at $300/month for 10 users, billed annually. Standard starts at $825/month for 25 GB of data, Premium starts at $2,750/month for 50 GB of data, and Enterprise is quote-based. Buyers should still model data capacity, user needs, Qlik Answers access, Predict capabilities, and deployment requirements before comparing it with simpler per-seat dashboard tools.
Limitations
Qlik is powerful but not the simplest AI dashboard generator for a small team. Its value comes from a more mature analytics model. If you just need a quick KPI board from a few SaaS apps, Databox or Zoho will usually be easier to start.
Best For
Qlik Sense is best for organizations that need exploratory analytics, governed BI, and AI insights beyond fixed dashboard views. Not the right fit if pricing transparency and lightweight setup are top priorities.
Get started with Qlik Sense
Hex
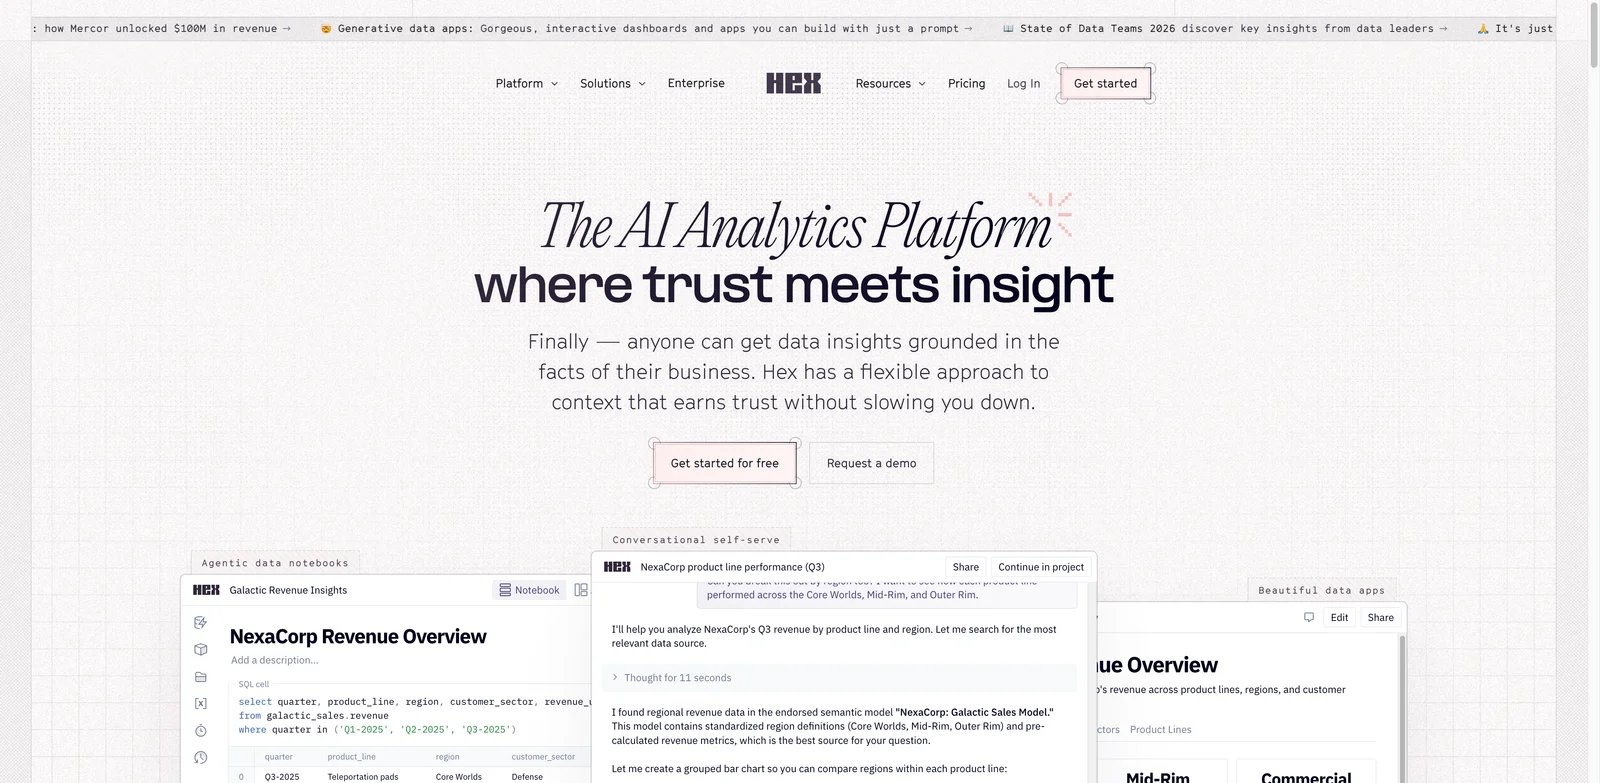
Data teams often build the best dashboard logic in notebooks, then struggle to turn that work into something executives and operators can use. Hex solves that handoff problem. It is not a traditional BI dashboard generator; it is an AI-native workspace where data teams can analyze, document, and publish reports, dashboards, and data apps from the same environment.
Key Features
- Notebook-to-app workflow: Analysts can move from SQL, Python, and analysis into polished apps and dashboards without switching tools.
- AI assistance: Hex supports AI help across analysis, explanation, and self-serve exploration workflows.
- Publishable data products: Reports and interactive apps can be shared with stakeholders instead of leaving work trapped in notebooks.
- Data-team collaboration: Versioning, comments, reusable logic, and technical workflows fit analytics teams better than pure business dashboards.
Pricing & Plans
Hex public pricing includes a free Community plan with a notebook agent trial, any data source connection, up to 5 notebooks, and small compute. Professional is $36/editor/month and includes the notebook agent, standard credits, unlimited notebooks, up to 5 published apps, 30-day version history, and medium compute. Team is $75/editor/month and adds Threads agent, semantic model agent, extended credits, unlimited published apps, visual exploration, scheduled runs, alerts, shared components, and shared collections. Hex also offers a 14-day Team trial with no payment card required.
Limitations
Hex has a higher skill floor than tools built for business users. It shines when analysts are involved. If your goal is to let every department head build dashboards without SQL, ThoughtSpot, Power BI, Zoho, or Databox may feel more approachable.
Best For
Hex is best for data teams that want AI-assisted analysis and dashboard publishing in one workspace. Not the right fit if you need a pure no-code dashboard builder for non-technical users.
Get started with Hex
Sigma
Warehouse-native teams often want spreadsheet-like exploration without exporting data out of the governed cloud warehouse. Sigma is built for that problem. It gives business users a familiar interface while keeping analytics closer to governed warehouse data, and its AI apps and insight features make it relevant in the AI dashboard generator category.
Key Features
- Warehouse-native BI: Sigma works directly on cloud warehouse data, reducing spreadsheet extracts and duplicated data marts.
- Spreadsheet-style UX: Business users can explore data in a familiar grid-like environment while analysts maintain governance.
- AI apps and insights: Sigma's AI direction focuses on governed insight generation and data apps rather than isolated chart prompts.
- Collaboration and operational workflows: It is useful when dashboards need to become repeatable business workflows.
Pricing & Plans
Sigma's commercial pricing is still primarily sales-led, although Sigma Public and free-trial paths may be available for evaluation. Buyers should ask for user tiers, warehouse compute implications, AI usage terms, app-building costs, embedded analytics pricing, and whether AI Apps, Agents, AI Query, and governed warehouse execution are included in the proposed package.
Limitations
Sigma depends on the quality of the warehouse and semantic setup behind it. It is not ideal for teams whose data is scattered across CSVs and small SaaS exports. Public pricing opacity also makes budget planning slower.
Best For
Sigma is best for cloud warehouse teams that want business users to explore governed data without leaving the warehouse. Not the right fit if you need quick dashboard generation from disconnected spreadsheets.
Get started with Sigma
Databox
Operators and marketing teams often need a live KPI dashboard faster than they need a full BI architecture. Databox is built for that operating cadence. It connects common data sources, turns metrics into shareable dashboards, and uses AI to help teams interpret performance, trends, and anomalies without asking a data team to build every view.
Key Features
- KPI dashboard focus: Databox is strong for marketing, SaaS, sales, and executive operating dashboards.
- Data-source library: It connects to many common SaaS sources and makes recurring performance dashboards easier to maintain.
- AI performance analysis: AI helps explain changes, surface trends, and support business reviews.
- Fast stakeholder sharing: Mobile, TV, scheduled reports, and dashboard sharing fit weekly operating rhythms.
Pricing & Plans
Databox has a Free plan with 3 data sources, 1 dashboard/report, 10 custom metrics, and 50 AI credits/month. Analyst starts at $64/month, billed annually, with 5 data sources and 500 AI credits/month. Pro starts at $159/month, billed annually, with unlimited users, unlimited dashboards/reports, 1,500 AI credits/month, and $5.60/month per additional data source. The main buying question is whether your source, dashboard, and AI credit limits fit the way your team runs reporting.
Limitations
Databox is narrower than enterprise BI tools. It is not designed to replace a governed semantic layer, advanced data modeling, or warehouse-native analytics. It is best for operational dashboards, not every analytics workload.
Best For
Databox is best for teams that need fast KPI dashboards across marketing, SaaS, sales, and leadership reporting. Not the right fit if you need complex data modeling, custom warehouse logic, or deep embedded analytics.
Get started with Databox
Best AI Dashboard Generators by Use Case
For Microsoft-Standardized Enterprises
If your company already runs Microsoft 365, Azure, Teams, and Excel-heavy workflows, Microsoft Power BI is the safest starting point. It gives your data team mature governance and gives business stakeholders AI help without forcing a new operating model. Tableau can still win if visual analytics quality matters more than Microsoft alignment.
For Business Users Who Ask Questions Before Building Dashboards
ThoughtSpot is the strongest choice when users want to search governed data conversationally. It is especially useful when the first question often leads to three follow-up questions. Qlik Sense is also strong here when relationship exploration matters more than a simple answer box.
For Lakehouse and Warehouse-Native Teams
Databricks AI/BI is the best fit for teams already operating inside the Databricks platform. Sigma is stronger when cloud warehouse data and spreadsheet-like exploration are central. Hex is the better pick when analysts need to publish apps and reports from notebook-style workflows.
For AWS-Centric Product and Data Teams
Amazon QuickSight should be tested first when the reporting stack already depends on AWS services. Amazon Q, embedded analytics, and AWS-native scaling make the buying case cleaner than adding a separate BI platform. The tradeoff is ecosystem dependency.
For SMBs and Operators Who Need Dashboards This Week
Zoho Analytics and Databox are the pragmatic picks. Zoho is broader and cheaper for general business reporting. Databox is better for KPI monitoring, marketing dashboards, SaaS metrics, and recurring business reviews. Neither should be mistaken for a full enterprise semantic layer.
How to Choose the Right AI Dashboard Generator
1. Decide whether you need governed BI or fast KPI reporting. If dashboards will influence board reporting, finance, sales compensation, or product decisions, start with governance-first tools such as Power BI, Tableau, Qlik, Sigma, or Databricks AI/BI. If the goal is weekly operating visibility, Zoho or Databox may be enough.
2. Map your data source reality before testing prompts. AI dashboard demos look good with clean demo data. Your real decision depends on whether the tool connects to your warehouse, spreadsheets, SaaS apps, or cloud platform without fragile exports.
3. Ask how AI is grounded. A useful AI dashboard generator should respect metric definitions, permissions, filters, and source lineage. If the AI can generate charts but cannot explain how numbers were calculated, do not scale it to executive reporting.
4. Model AI and viewer costs separately. BI pricing is rarely just the author price. Check viewer seats, AI query credits, embedded usage, warehouse compute, refresh limits, and whether Copilot or agent features require higher plans.
5. Run a two-dashboard pilot. Build one executive KPI dashboard and one exploratory dashboard. The first tests governance and sharing. The second tests whether AI actually helps users answer follow-up questions without analyst intervention.
Frequently Asked Questions
What is the best AI dashboard generator overall?
Which AI dashboard generator is easiest for small teams?
Are AI dashboard generators accurate enough for executive reporting?
What is the difference between an AI dashboard generator and an AI data analysis tool?
Which tools are best for warehouse-native analytics?
Do AI dashboard generators replace data analysts?
What should I test before buying an AI dashboard generator?
Get ToolWorthy Weekly
New AI tools, practical guides, and selected AI signals in one weekly brief.
Built an AI dashboard generator we missed?
We review these roundups regularly. If your AI dashboard generator belongs here, submit it for editorial review and reach buyers already searching for it.
Listings start at $49 — live in 24 hours, permanent placement, full refund if we don't approve yours.