
13 Best AI Data Analysis Tools 2026 — Real Costs, Honest Limits
Compare 13 AI data analysis tools by user type, data location, governance, pricing model, and verification workflow.

On this page
Your quarterly review is tomorrow, the CEO wants to know why churn spiked in Q1, and you're still writing SQL joins to merge three data sources that should have been connected months ago. Meanwhile, the "AI-powered analytics" tool your team adopted last year just raised its per-query pricing — again — and the natural language feature still can't handle anything beyond "show me revenue by month." Choosing the wrong AI data analysis platform doesn't just waste your software budget; it burns analyst hours on tool babysitting instead of actual insight discovery.
To map capabilities, workflows, integrations, and the wider market without rankings, browse the AI Data Analysis Tools category landscape.
This guide compares 13 candidates across AI-native analytics, modern BI with AI layers, conversational analysis, and AI-enhanced spreadsheets. The shortlist is organized around the questions that determine fit: who will ask the questions, where the governed data lives, how answers can be traced and verified, and how seat, credit, and warehouse-compute costs scale.
For teams that also need to clean and prepare data before analysis, our best AI data cleaning tools guide covers the upstream side of the analytics pipeline.
| Tool | Best For |
|---|---|
| Hex | Data teams wanting AI-native notebooks with collaborative analytics |
| ThoughtSpot | Enterprises needing natural language search across large datasets |
| Julius AI | Non-technical users who want conversational data analysis |
| Metabase | Teams wanting open-source BI with AI querying on a budget |
| Zoho Analytics | SMBs already in the Zoho ecosystem needing affordable AI analytics |
| Sigma | Analysts who think in spreadsheets but need cloud warehouse power |
| Qlik | Enterprises needing associative data exploration with AI assist |
| Tellius | Data teams that need automated root cause analysis |
| Power BI | Microsoft-stack organizations wanting Copilot-augmented BI |
| Omni | Modern data teams building semantic layers on cloud warehouses |
| Tableau | Teams needing industry-standard visualization with AI enhancements |
| Domo | Organizations wanting a full-stack cloud BI platform |
| Rows | Small teams needing AI-enhanced spreadsheets for quick analysis |
How We Selected and Reviewed
Candidates were identified from analyst coverage, product directories, vendor documentation, and data-practitioner discussions. Pure ETL tools, developer libraries, and BI products without a documented AI analysis workflow were excluded.
Our research methodology combined multiple data sources to ensure accuracy. We analyzed official product documentation, pricing pages, and privacy policies, cross-referenced user reviews from G2, Capterra, Reddit, and Trustpilot, and tracked pricing model changes that occurred between January and March 2026. This multi-source approach helped identify discrepancies between marketing claims and actual user experiences — particularly around AI query accuracy, hidden consumption costs, and data warehouse compute charges that don't appear on the sticker price.
Evaluation Dimensions: The comparison uses five dimensions that matter to analysts and business buyers:
- Functionality — data source connectivity, visualization depth, predictive analytics, collaboration, and governance controls
- User Experience — onboarding, natural-language workflow, documentation, and learning curve for the intended user
- Verification — query traceability, semantic-layer controls, auditability, and paths for checking generated analysis
- Value for Money — free-tier usefulness, pricing transparency, seat or credit scaling, and warehouse-compute exposure
- Deployment Fit — cloud or self-hosted options, data location, permissions, and integration with the existing analytics stack
Research Scope: This is a source-based comparison, not a common-dataset or hands-on benchmark. Product and public pricing facts were checked against official documentation; enterprise products with custom contracts still require a proof of concept and written quote.
Transparency & Limitations: All information comes from official sources and credible third-party platforms — we don't fabricate ratings, rankings, or performance claims. AI analytics tools update frequently; pricing and features may have changed since our research cutoff. Several tools (ThoughtSpot, Sigma, Domo) underwent pricing model changes in 2025–2026, so we note the most recent model for each.
Top 13 AI Data Analysis Tools Compared
The AI data analysis landscape in 2026 falls into four categories: AI-native analytics platforms (Hex, Julius AI, Tellius), modern BI with AI layers (ThoughtSpot, Sigma, Qlik, Omni), traditional BI with AI add-ons (Power BI, Tableau, Domo), and lightweight AI-enhanced tools (Metabase, Zoho Analytics, Rows). The biggest differentiators are pricing model (per-user vs. consumption-based vs. custom enterprise), AI query accuracy (keyword search vs. true natural language), and deployment flexibility (cloud-only vs. self-hosted options).
| Tool | Best For | Pricing | Free Tier | AI Capability | Platform |
|---|---|---|---|---|---|
| Hex | AI-native collaborative analytics | Free–$75+/editor/mo | Yes | AI notebooks + agents | Web |
| ThoughtSpot | Enterprise NL search | From $25/user/mo | No | Spotter AI Agent | Web |
| Julius AI | Conversational analysis | Free–$625+/mo | Yes (100 credits/mo) | Chat-based analysis + data agents | Web |
| Metabase | Open-source AI BI | Free / Cloud $100+/mo | Yes (self-hosted) | NL querying | Web / Self-hosted |
| Zoho Analytics | SMB AI analytics | Free–$25+/mo | Yes (2 users) | Ask Zia AI | Web |
| Sigma | Spreadsheet + warehouse | From ~$300/mo | Yes (limited) | AI assist | Web |
| Qlik | Associative exploration | From $300/mo | Trial available | Insight Advisor + AI analytics | Web / Cloud |
| Tellius | Automated root cause | Custom | Trial available | Guided Insights + search-driven analytics | Web |
| Power BI | Microsoft ecosystem | Free–$14+/user/mo | Yes (Desktop) | Copilot | Desktop + Web |
| Omni | Modern data modeling | Custom | No | AI-powered | Web |
| Tableau | Enterprise visualization | From $15/user/mo | No | Tableau Pulse + AI | Desktop + Web |
| Domo | Full-stack cloud BI | Custom | 30-day trial | AI/ML tools | Web |
| Rows | AI spreadsheet analysis | Free–$79+/mo | Yes (5 AI tasks/mo) | AI Analyst | Web |
Detailed Reviews


Your data team is tired of context-switching between Jupyter notebooks for analysis, a BI tool for dashboards, and Slack for sharing results. Hex collapses that workflow into a single collaborative canvas where SQL, Python, and AI-generated insights live side by side — and anyone on the team can comment, fork, or schedule a refresh without leaving the browser.
Key Features
-
Magic AI for Code and Analysis — Generates SQL queries, Python code, and chart configurations from natural language prompts. Unlike chatbot-style tools, Magic works inline within your notebook cells, so AI output flows directly into your existing analysis pipeline rather than sitting in a separate chat window.
-
Collaborative Notebook Canvas — Multiple analysts can work on the same project simultaneously with real-time commenting, version history, and branching. This eliminates the "email me the notebook" workflow that plagues Jupyter-based teams.
-
Scheduled Runs and App Publishing — Turn any notebook into a scheduled report or interactive web app that stakeholders can filter and explore without touching code. Reports auto-refresh on your schedule and push to Slack or email.
-
Native Data Warehouse Integration — Connects to Snowflake, BigQuery, Databricks, Redshift, and PostgreSQL with push-down execution. This can keep analysis close to governed data, but warehouse compute remains a separate cost to model.
Pricing & Plans
- Community: Free — base plan for individual use
- Professional: $36/editor/month — Notebook agent, standard credits, unlimited notebooks, up to 5 published apps, medium compute
- Team: $75/editor/month — Threads agent, semantic model agent, scheduled runs, alerts, shared collections, unlimited published apps
- Enterprise: Custom — explorer seat add-on, audit logs, OIDC SSO, observability API, dedicated support
TCO Note: Hex now separates seat pricing from advanced compute. Medium compute is included on paid plans, while larger compute profiles and advanced compute add-ons can increase total cost for heavy scheduled or data science workloads.
Limitations
- Querying datasets over 1M rows can produce noticeable lag in interactive mode, disrupting the exploratory analysis flow.
- The notebook interface works well for SQL/Python users, but non-technical business users often struggle to create analyses without coding knowledge.
- Compute-minute pricing on top of seat fees makes budgeting unpredictable for teams with heavy scheduled workloads.
Pros & Cons
Pros
- Strong fit for SQL/Python-first analytics teams
- Collaborative notebooks, apps, and scheduling in one browser-based workflow
- Clearer current packaging around Notebook agent, Threads agent, and semantic model agent
Cons
- Paid team pricing is materially higher than many expect from a notebook tool
- Advanced compute can add usage-based cost on top of seat pricing
- Still less natural for fully non-technical dashboard consumers than search-first BI tools
Best For
Hex fits data teams (analysts, data scientists, analytics engineers) who want one tool for exploration, visualization, and sharing — and who are comfortable writing SQL or Python. Not the right fit if your primary users are non-technical business stakeholders who need point-and-click dashboards.
Get started with Hex

Your VP of Sales just asked "why did deal velocity drop in EMEA last quarter" and expects an answer in minutes, not days. ThoughtSpot is built for exactly this scenario — it lets business users type questions in plain English and get interactive charts back instantly, without submitting a ticket to the data team. Its Spotter AI Agent goes further by proactively surfacing anomalies and suggesting follow-up questions.
Key Features
-
Natural Language Search Analytics — Type questions like "revenue by region last 6 months" and get instant visualizations. ThoughtSpot's search engine understands synonyms, date ranges, and aggregations without requiring users to learn a query language — though getting precise results still requires learning the tool's preferred phrasing patterns.
-
Spotter AI Agent — An agentic analytics layer that autonomously investigates data anomalies, generates multi-step analyses, and recommends next questions. Spotter doesn't just answer what you ask — it tells you what you should be asking.
-
Liveboards with Real-Time Monitoring — Interactive dashboards that update in real-time and support drill-down, filtering, and sharing. Business users can create and modify Liveboards without analyst assistance.
-
Embedded Analytics API — White-label ThoughtSpot's search and visualization capabilities into your own SaaS product, so your customers get AI-powered analytics without you building it from scratch.
Pricing & Plans
- Essentials: $25/user/month (5–50 users, up to 25M rows)
- Pro: $50/user/month (25–1,000 users, up to 250M rows, includes Spotter AI Agent)
- Enterprise: Custom pricing (unlimited users and data volume)
TCO Note: Public entry pricing does not represent a full enterprise deployment. Ask for a written quote that includes user roles, data volume or consumption, implementation, support, and renewal terms.
Limitations
- The "natural language" search requires learning specific phrasing patterns — it's not truly freeform. Complex multi-join queries often return unexpected results or require manual refinement.
- Dashboard customization is limited compared to Tableau or Power BI — you can't change font sizes, card dimensions, or chart styling at the granular level power users expect.
- Customer support quality has declined according to multiple G2 reviewers, with slow response times on non-critical tickets.
Best For
ThoughtSpot fits enterprises with governed warehouse data that want business users to explore through natural language without writing SQL. It is a weaker fit when spreadsheet uploads dominate, deeply customized dashboards are the priority, or a sales-led evaluation cannot clear the procurement budget.
Get started with ThoughtSpot
Julius AI
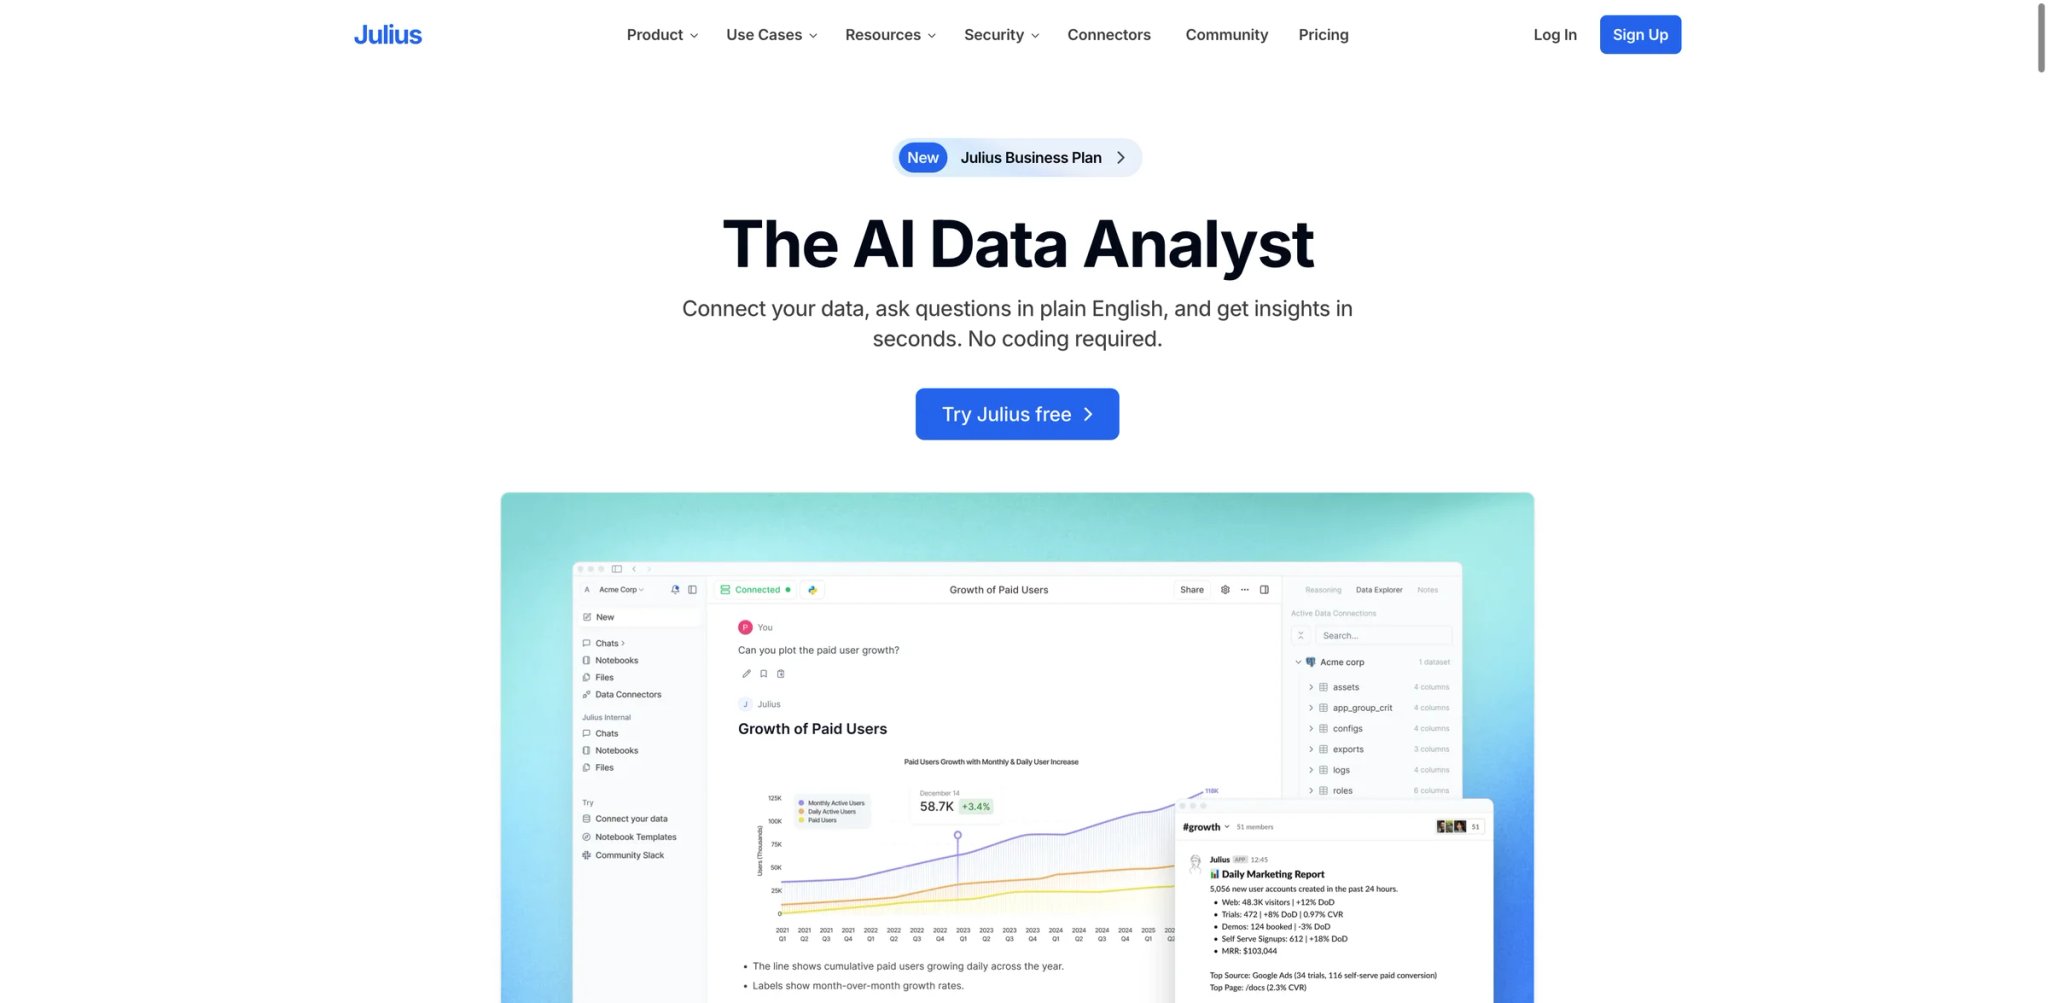
You just received a 50-column CSV from the marketing team and need to find the three insights that matter before this afternoon's meeting — but you don't write SQL and your company's BI tool requires a two-week onboarding. Julius AI lets you drag-and-drop a file, ask questions in plain English, and get charts and statistical summaries back in seconds. It's the fastest path from raw data to actionable insight for non-technical users.
Key Features
-
Conversational Data Analysis — Upload a CSV, Excel file, or connect a database, then ask questions like "what's the correlation between ad spend and conversions by channel." Julius generates Python code behind the scenes, executes it, and returns charts and statistical results — no coding required from the user.
-
Instant Visualization Generation — Automatically suggests relevant chart types based on your data structure and question. Charts are interactive and exportable, saving the typical 30-minute cycle of formatting in Excel or Google Sheets.
-
Multi-Format Data Support — Accepts CSV, Excel, Google Sheets, PDF tables, and database connections. This breadth matters for teams that receive data in inconsistent formats from different departments.
-
Analysis History and Sharing — Every conversation is saved and shareable via link, creating an audit trail of how insights were derived. Useful for teams that need to show their work.
Pricing & Plans
- Free: $0/month — 100 credits/month, notebooks, Google Drive connector, 2 GB RAM
- Plus: $20/month ($16/month billed annually) — 2,000 credits/month, 1 seat, Plus models
- Pro: $40/month ($33/month billed annually) — 4,000 credits/month, Pro models, expanded context window, 32 GB RAM
- Business: $450/month ($375/month billed annually) — 45,000 credits/month, 10 seats, Snowflake/BigQuery/Postgres connectors, shared workspace features
- Growth: $750/month ($625/month billed annually) — 75,000 credits/month, up to 30 seats, knowledge base connections, unlimited custom agents
- Enterprise: Custom — for larger deployments beyond 30 seats
TCO Note: Julius no longer uses the old low-cost Business/Enterprise ladder. Costs rise quickly once you need team seats, warehouse connectors, or organization-wide deployment.
Limitations
- Julius can hallucinate statistics when column labels are ambiguous or data is sparse — it generates plausible-looking numbers that are incorrect. Always verify critical findings against the source data.
- The free tier's 100 credits per month is limited for serious ongoing use, since most multi-step analyses consume credits quickly.
- Files over 50MB occasionally cause processing errors or timeouts, limiting usefulness for large enterprise datasets.
Pros & Cons
Pros
- Very fast path from uploaded files or connected data to conversational analysis
- Current pricing page clearly distinguishes individual, team, and growth plans
- Broader connector story than many chat-based analysis tools
Cons
- Free plan is still too limited for serious ongoing use
- Team pricing jumps sharply once you need shared workspaces and warehouse connectors
- Critical outputs still need verification when data labels or schemas are messy
Best For
Julius AI fits non-technical users (marketers, PMs, executives) who need quick answers from structured data without learning SQL or Python. Not the right fit if you need to analyze datasets over 50MB, require enterprise governance controls, or want to build production dashboards for ongoing monitoring.
Get started with Julius AI

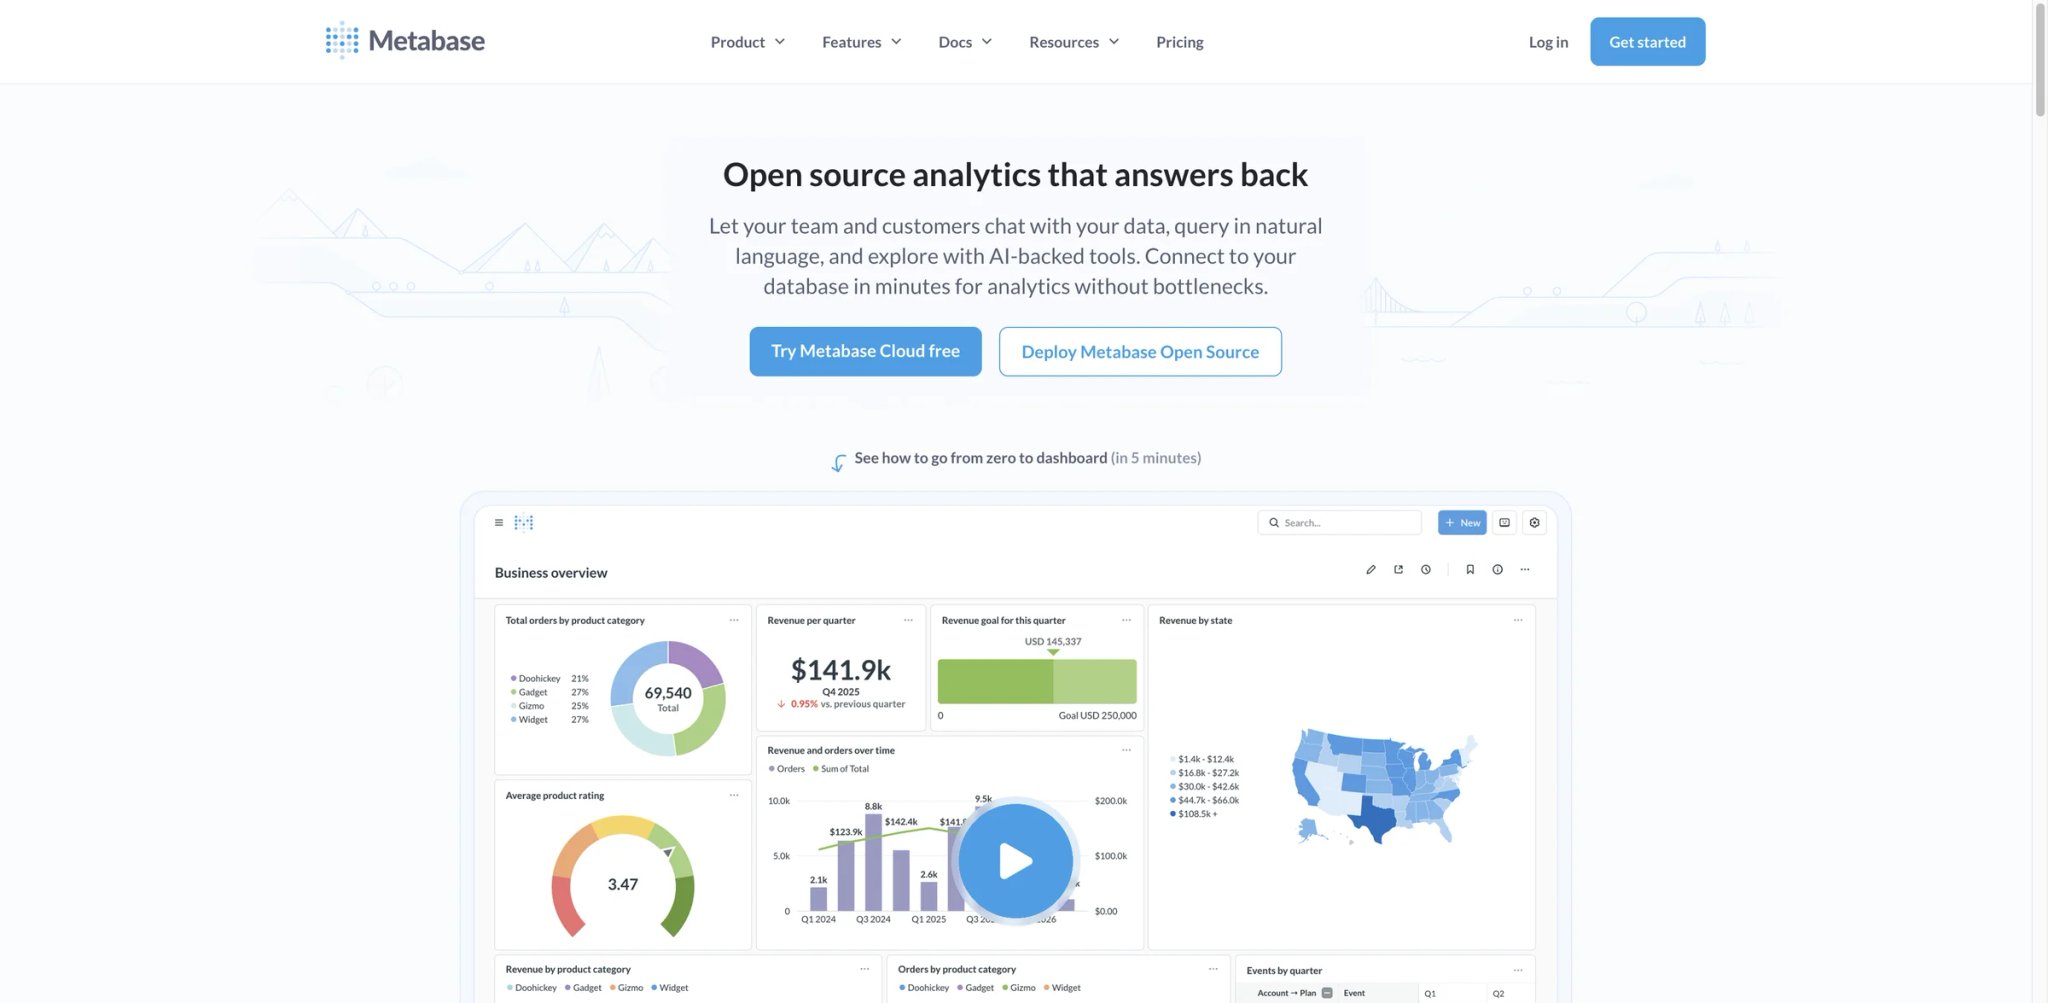
Metabase is a shortlist candidate for teams that want open-source, self-hosted BI or a lower-cost managed cloud path. The open-source edition covers core dashboards and querying, while Metabot and other AI availability depends on the current paid plan and deployment; do not assume self-hosting includes every AI feature.
Key Features
-
Open-Source with Self-Hosting — Deploy on your own infrastructure with full source code access. No vendor lock-in, no per-user licensing, and complete control over data residency. The open-source version includes core BI features that competitors charge $50+/user/month for.
-
Natural Language Querying — Ask questions in plain English and Metabase translates them into SQL queries against your database. Non-technical users can explore data without learning SQL, though complex queries still benefit from the visual query builder.
-
One-Click Dashboard Creation — Build interactive dashboards with drag-and-drop, then share via URL or embed in your product. The learning curve is significantly lower than Tableau or Power BI for basic dashboard creation.
-
Extensive Database Connectivity — Connects natively to PostgreSQL, MySQL, MongoDB, BigQuery, Snowflake, Redshift, and 20+ other databases. No separate connector licenses required.
Pricing & Plans
- Open Source: Free forever — self-hosted, community support
- Starter: $100/month + $6/month per user — cloud-hosted, first 5 users included, Metabot AI available
- Pro: $575/month + $12/month per user — first 10 users included, cloud or self-hosted, SSO and advanced permissions
- Enterprise: Custom pricing, starting at $20K/year — procurement support, priority support, optional single-tenant hosting and professional services
TCO Note: The self-hosted open-source edition is still genuinely free, but current paid cloud pricing starts at $100/month for Starter and $575/month for Pro, with per-user charges on top.
Limitations
- Performance degrades noticeably with large datasets or heavy concurrent usage — expect slower load times when 20+ users query simultaneously.
- No built-in predictive analytics or statistical modeling — Metabase handles descriptive analytics well but can't forecast or run regression analyses.
- Dashboard building UX is "too complicated with too few options" according to multiple users — the gap between simple charts and customized layouts is frustrating.
Best For
Metabase fits startups and mid-size teams that want capable BI without enterprise pricing, especially those comfortable with self-hosting. Not the right fit if you need advanced predictive analytics, handle datasets with 100M+ rows under heavy concurrent load, or require white-glove vendor support.
Get started with Metabase

Your 50-person company already runs on Zoho CRM, Zoho Projects, and Zoho Books — but your analytics are still scattered across spreadsheets and manual exports. Zoho Analytics pulls data from the entire Zoho suite (plus 500+ external connectors) into a single AI-powered analytics workspace, and the per-user pricing won't make your CFO flinch.
Key Features
-
Ask Zia AI Assistant — Type questions in conversational English and Zia returns visualizations, forecasts, and anomaly alerts. Zia has been in production since 2018, making it one of the more mature AI analytics assistants — less flashy than newer entrants but more reliable on routine queries.
-
500+ Data Connectors — Natively integrates with the entire Zoho ecosystem plus Salesforce, HubSpot, Google Analytics, QuickBooks, Shopify, and major databases. For Zoho-stack companies, data flows in without any ETL configuration.
-
Automated Reporting and Alerts — Schedule reports to stakeholders' inboxes and set threshold-based alerts for KPI deviations. Reports can be customized per recipient with row-level filtering.
-
Embedded Analytics — White-label Zoho Analytics dashboards into your own product with full API access. Useful for SaaS companies that want to offer analytics to their customers without building from scratch.
Pricing & Plans
- Free: $0 — 2 users, 10K rows, 5 workspaces
- Basic: $24/month billed annually — 2 users, 0.5M rows
- Standard: $60/month — 5 users, 1M rows
- Premium: $145/month — 15 users, 5M rows
- Enterprise: $575/month — 50 users, 50M rows
TCO Note: Zoho Analytics pricing is still based on both users and row limits. Additional users start at $8/user/month, viewer add-ons start at $4/viewer/month with a 25-viewer minimum, and annual plans include a 30-day cashback window.
Limitations
- Most integrations update only hourly or daily — no real-time data streaming. If you need up-to-the-minute dashboards, Zoho Analytics isn't the right choice.
- Advanced report customization requires formula columns and sometimes custom coding, which defeats the "no-code" promise for complex use cases.
- Performance degrades with large datasets — SQL query length limitations and slow rendering on dashboards with 10+ visualizations.
Best For
Zoho Analytics fits SMBs and mid-market companies already using the Zoho ecosystem that want affordable, competent AI analytics without enterprise complexity. Not the right fit if you need real-time data streaming, work with datasets over 50M rows, or your data lives primarily outside the Zoho ecosystem.
Get started with Zoho Analytics
Sigma
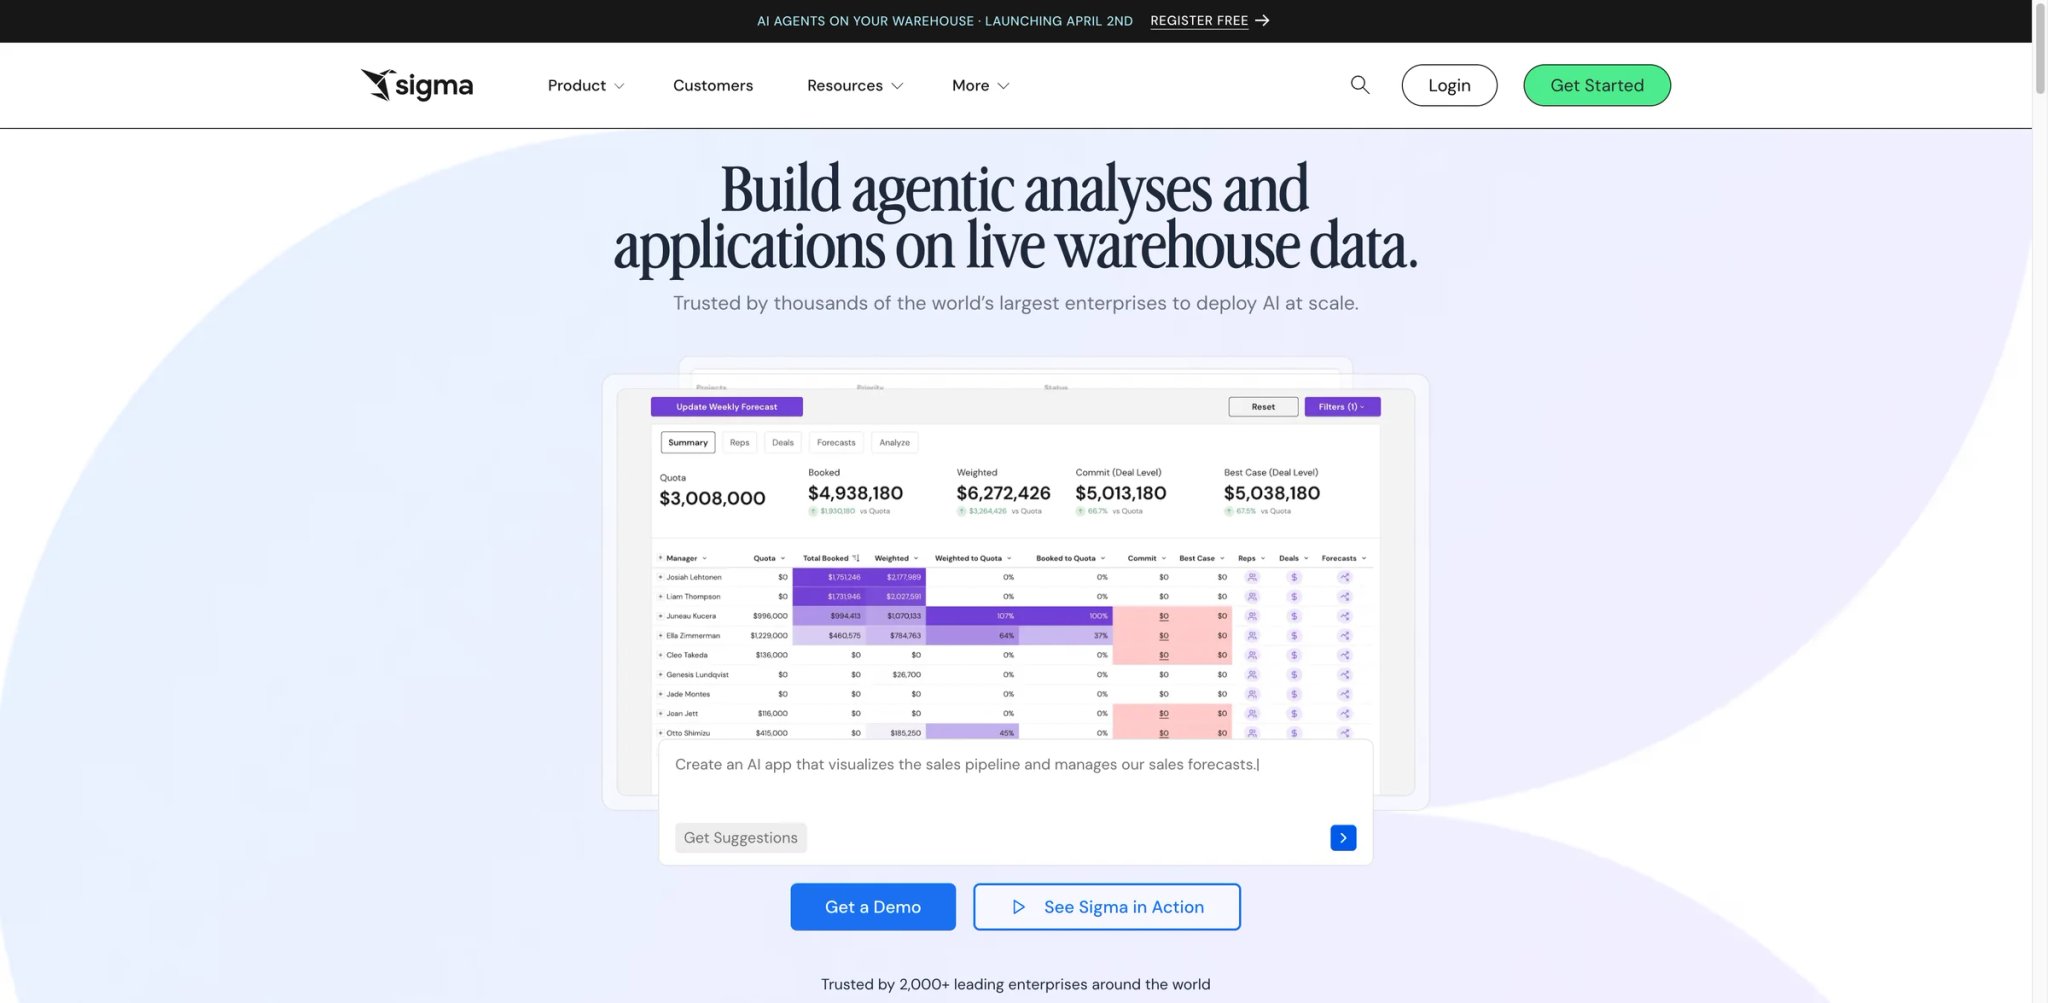
Your business analysts love spreadsheets but your data lives in Snowflake, and every ad-hoc question requires a ticket to the data engineering team. Sigma bridges this gap — it looks and feels like a spreadsheet but queries your cloud data warehouse directly, so analysts can explore billions of rows with familiar formulas while data engineers maintain governance and modeling control.
Key Features
-
Spreadsheet Interface on Live Data — Uses familiar spreadsheet formulas and pivot tables, but every operation runs as a query against your cloud warehouse (Snowflake, BigQuery, Databricks). Analysts get the flexibility of Excel with the scale of a data warehouse — no extracts, no row limits.
-
AI-Assisted Analysis — Generate formulas, suggest charts, and explain data patterns using natural language prompts within the spreadsheet environment. Reduces the learning curve for users transitioning from Excel.
-
Write-Back Capabilities — Analysts can write data back to the warehouse from Sigma, enabling planning, forecasting, and data correction workflows that most BI tools don't support.
-
Governed Data Access — Data engineers define the semantic layer and permissions; business users explore freely within those boundaries. This balances self-service with control.
Pricing & Plans
- Free: Limited individual use
- Paid: Starts from approximately $300/month — per-user pricing requires contacting sales
- Enterprise: Custom — advanced governance, SSO, dedicated support, unlimited viewers
TCO Note: Sigma's license cost is only part of the equation — every query runs on your cloud warehouse, so compute costs (Snowflake credits, BigQuery slots) scale with user activity. Teams with 50+ active analysts should model warehouse costs alongside Sigma licensing.
Limitations
- Compute costs scale unpredictably because every user action triggers warehouse queries — there's no clear visibility into how individual actions impact spending.
- Filter loading and dashboard refreshes can be slow enough that some users export to Excel instead, undermining the tool's core value proposition.
- Requires a cloud data warehouse — organizations with on-premise infrastructure cannot use Sigma at all.
- Despite the "spreadsheet-like" promise, only data analysts can realistically create complex reports — business users still need training.
Best For
Sigma fits data teams with a cloud data warehouse (Snowflake, BigQuery, Databricks) that want to give spreadsheet-fluent analysts direct warehouse access under governance controls. Not the right fit if your data is on-premise, you don't have a cloud warehouse, or you need a tool that non-technical users can operate independently from day one.
Get started with Sigma
Qlik
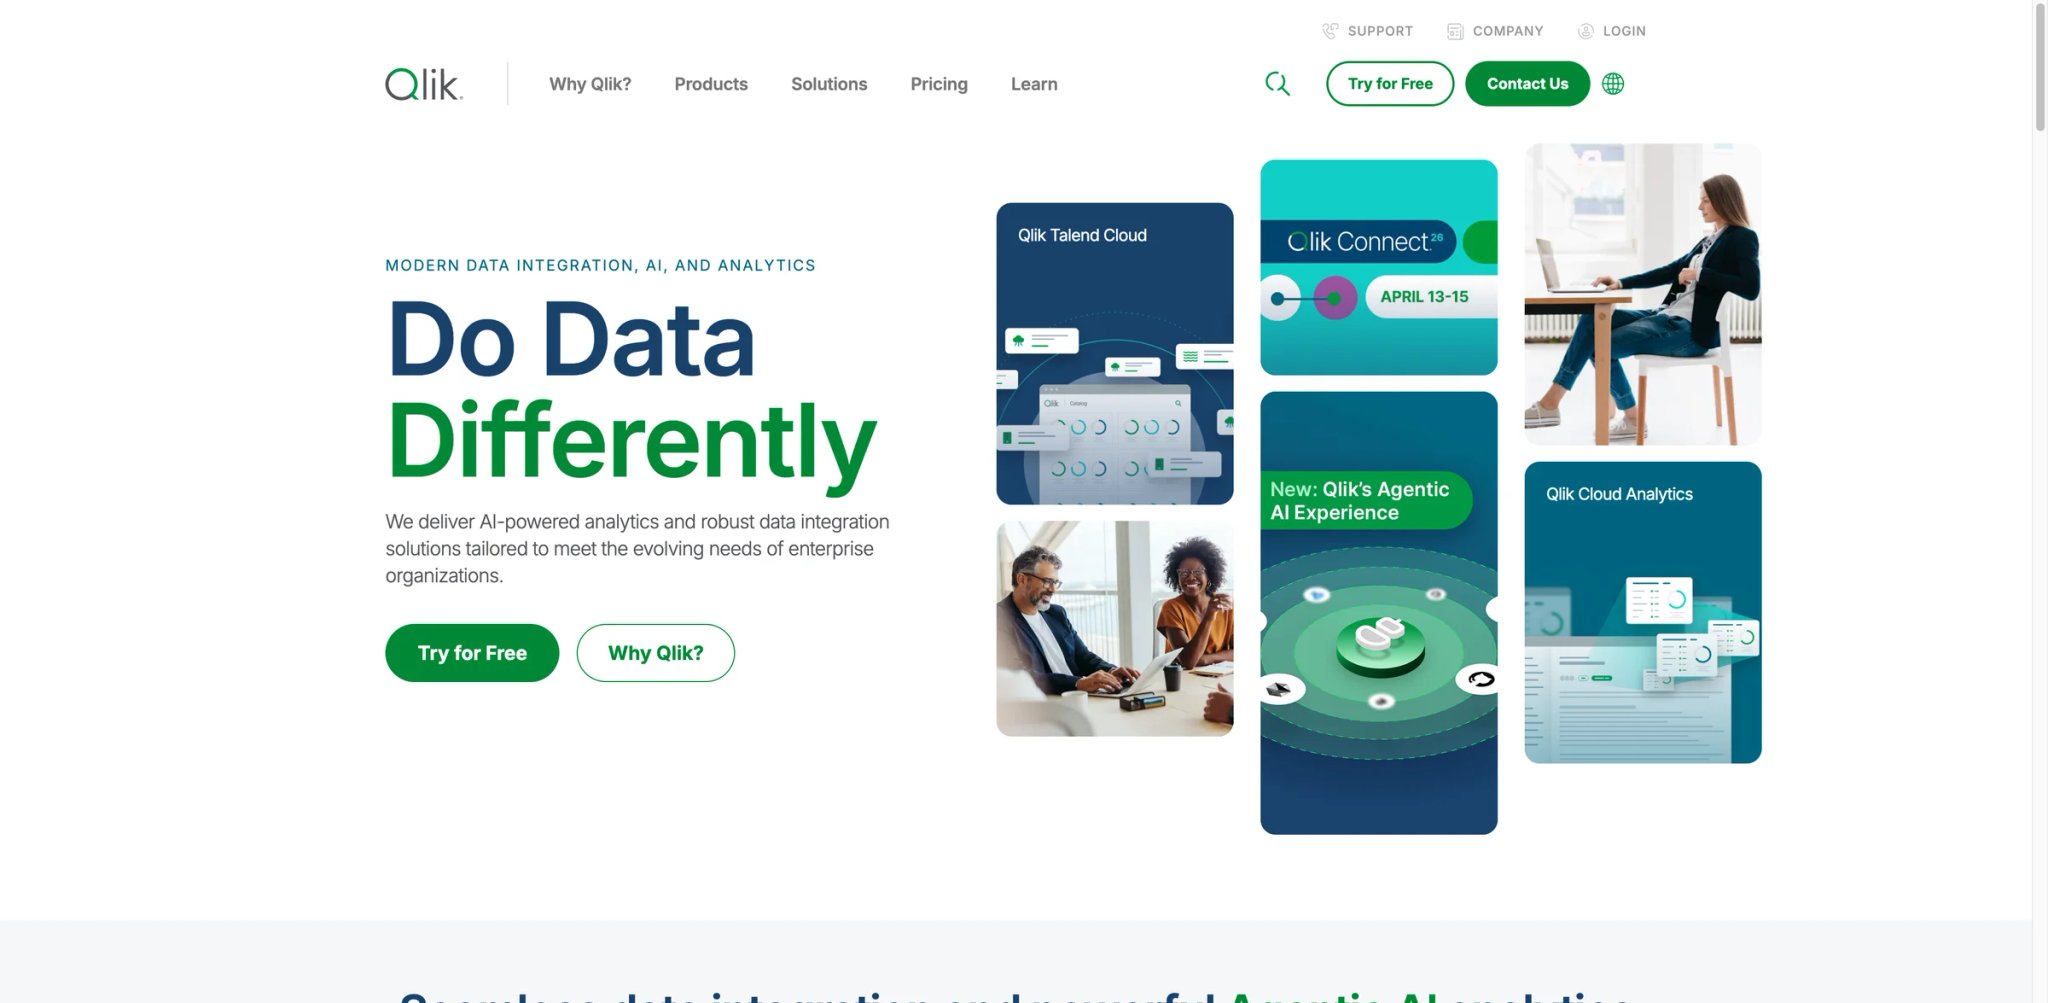
Your enterprise has data in SAP, Salesforce, Oracle, and a dozen spreadsheets — and every time someone asks a new question, the answer requires a new report because your current BI tool only follows predefined drill-down paths. Qlik's associative engine lets users click on any data point and instantly see how it relates to everything else in the dataset, revealing connections that SQL-based tools miss entirely.
Key Features
-
Associative Data Engine — Unlike SQL-based tools that follow predefined joins, Qlik's engine dynamically highlights relationships across all data sources in real time. Click "Q3 revenue" and instantly see which products, regions, and sales reps are associated — including what's not related (shown in gray), which is often where the insight hides.
-
Insight Advisor AI — Generates suggested visualizations and analyses from natural language queries. Insight Advisor learns from user behavior over time, improving suggestion relevance as your team uses it.
-
Enterprise-Grade Governance — Centralized data catalog, lineage tracking, row-level security, and multi-cloud deployment options. Built for organizations with strict compliance requirements (HIPAA, SOC 2, GDPR).
-
End-to-End Data Pipeline — Includes data integration and transformation (via Qlik Data Integration) alongside analytics, reducing the need for separate ETL tools.
Pricing & Plans
- Starter: $300/month billed annually — 10 users, 10 GB data for analysis
- Standard: $825/month billed annually — 25 GB data for analysis, additional capacity available
- Premium: $2,750/month billed annually — 50 GB data for analysis, predictive analytics and more GenAI capacity
- Enterprise: Custom quote — starts at 250 GB of data for analysis
TCO Note: Qlik's current public pricing is capacity-based, not the older per-user framing. Budgeting should center on included data-for-analysis capacity, add-on capacity, and deployment/support requirements.
Limitations
- Deployment and migration options vary by Qlik product and contract, so existing on-premises customers should confirm the supported path before treating the cloud plan as a direct replacement
- Only one person can edit a dashboard at a time — simultaneous collaboration requires workarounds through the admin panel.
- Complex transformations require load script coding rather than visual configuration, creating a dependency on Qlik-specific scripting knowledge.
- Direct vendor support is frustrating according to users — many pay Qlik partners hourly for support instead.
Best For
Qlik fits enterprises with complex, multi-source data environments that need associative exploration and strong governance. Not the right fit if you're a small team, want collaborative editing, or prefer a modern cloud-native UI over Qlik's enterprise-oriented interface.
Get started with Qlik
Tellius
Your marketing team spent $2M more than planned last quarter, and nobody can explain why. Traditional BI tools show you what happened — Tellius shows you why. Its automated root cause analysis digs through millions of data combinations to surface the specific factors driving a metric change, a process that would take a human analyst days of manual segmentation.
Key Features
-
Automated Root Cause Analysis — Point Tellius at a KPI anomaly and it automatically segments your data across every dimension to find the statistically significant drivers. Instead of manually testing "was it region? product? channel?" one at a time, Tellius runs thousands of combinations simultaneously.
-
Natural Language Search with AutoInsights — Ask questions in plain English and get visualizations plus proactive insights — not just the chart you asked for, but related patterns and anomalies Tellius discovered in the process.
-
Machine Learning Without Code — Build predictive models (classification, regression, clustering) through a visual interface. Data analysts can run forecasting and segmentation without writing Python or R.
-
Live Data Connections — Connects to Snowflake, Redshift, BigQuery, and Databricks with push-down query processing, keeping data in the warehouse and reducing latency.
Pricing & Plans
- Premium: Custom pricing — up to 10 users, guided insights, search-driven ad hoc visualization, cloud/app/database connectivity, and up to 50M live-mode rows
- Enterprise: Custom pricing — unlimited users, automated ML modeling, SAML SSO, APIs, embedding, and unlimited data scale
- Trial: Available from the pricing page
TCO Note: Tellius no longer publishes user-based pricing on its official pricing page. Treat Tellius as a custom-quote platform and validate implementation scope, deployment, and support costs during evaluation.
Limitations
- Pricing is still custom and larger deployments still require sales involvement, which adds friction for teams that want fast budget clarity.
- Natural language processing can struggle with complex, multi-condition queries — results become less reliable as question complexity increases.
- Smaller user community means fewer online resources, tutorials, and peer support compared to Tableau, Power BI, or Metabase.
Best For
Tellius fits data teams that regularly need to explain why metrics changed and want guided investigation rather than manual drill-down. It is a weaker fit when buyers need self-serve price and trial clarity or only need straightforward dashboards.
Get started with Tellius

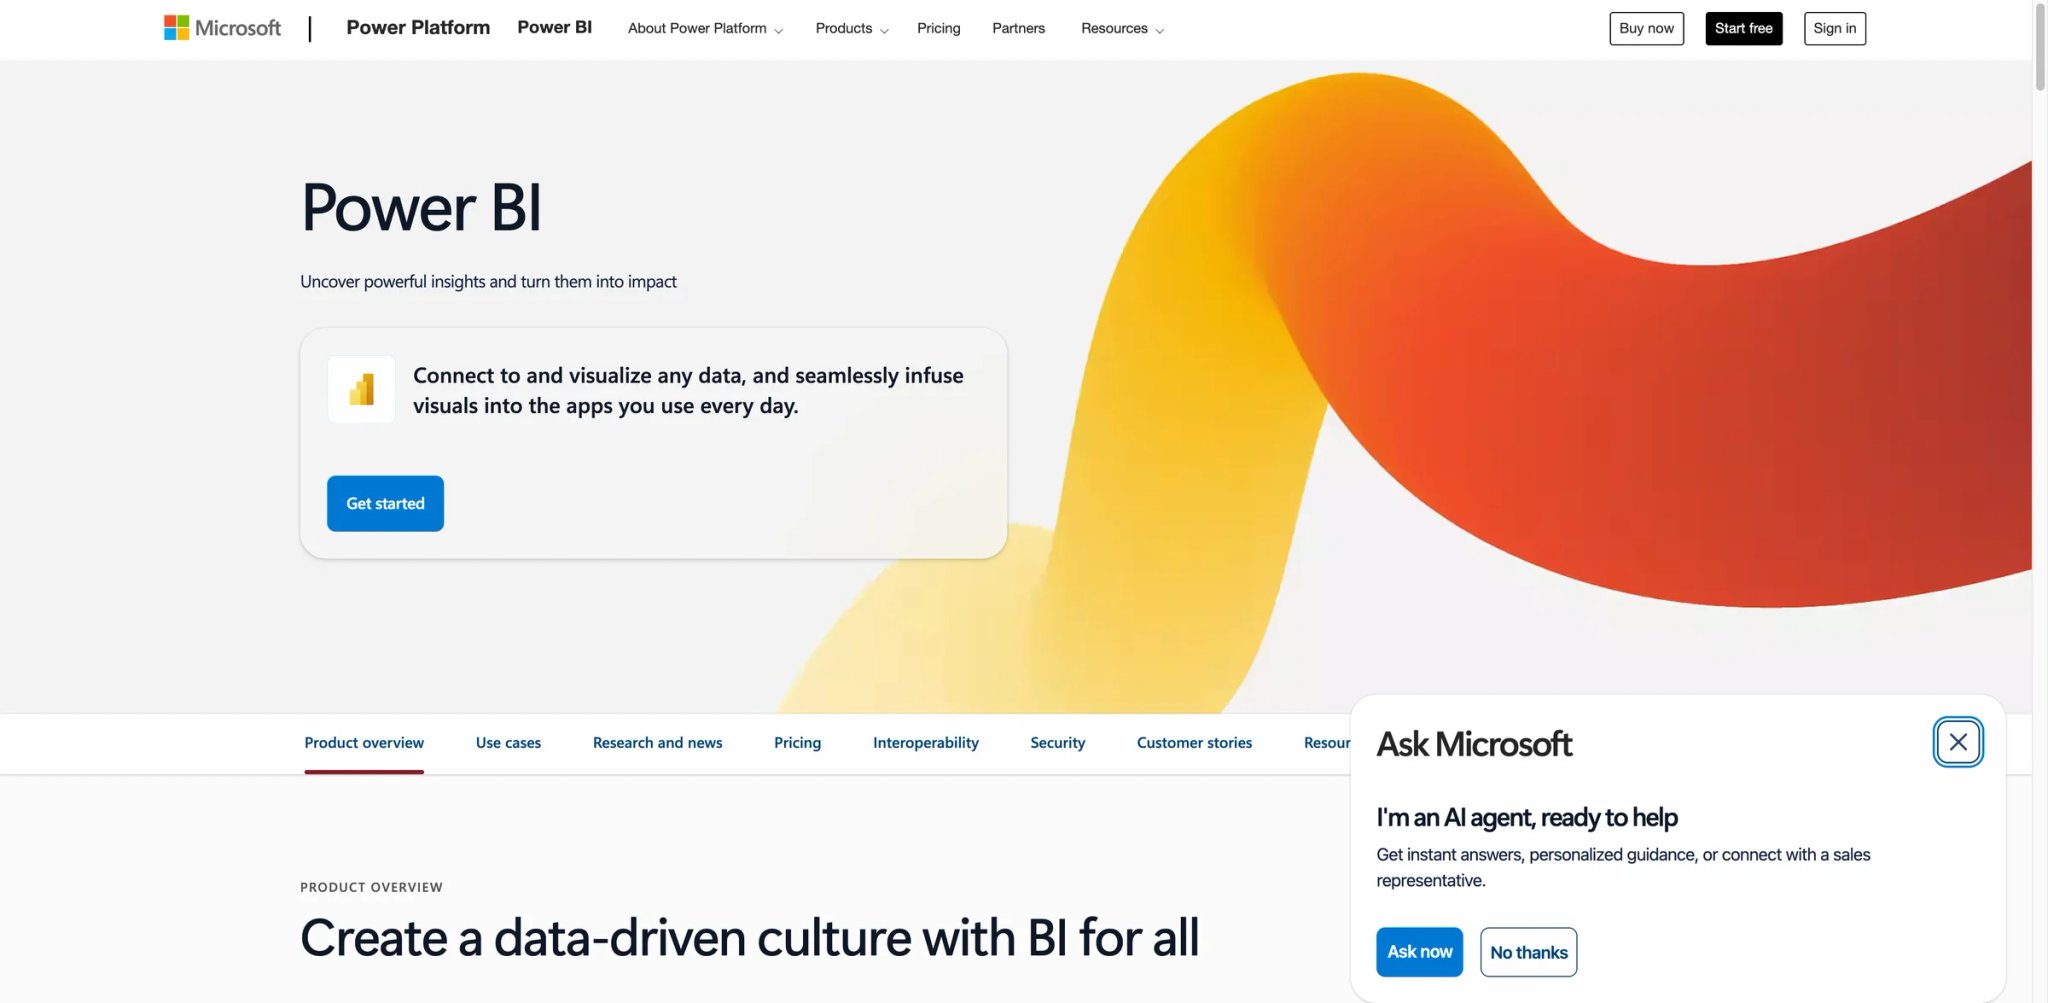
Your company runs on Microsoft 365, your data is in Azure SQL and SharePoint, and your CFO already pays for E5 licenses — so buying another analytics platform feels redundant. Power BI is the natural choice for Microsoft-stack organizations, and with Copilot integration, it now lets users generate DAX formulas, create reports, and summarize dashboards using natural language. But the "free" story has significant asterisks.
Key Features
-
Copilot AI Integration — Generate DAX measures, build report pages, summarize dashboard insights, and create narrative summaries using natural language prompts. Copilot reduces the DAX learning curve that has historically been Power BI's biggest adoption barrier.
-
Microsoft Ecosystem Integration — Native connectivity to Excel, SharePoint, Azure SQL, Dynamics 365, Dataverse, and Teams. Reports embed directly in Teams channels and SharePoint pages, meeting users where they already work.
-
Semantic Model and Dataflows — Build reusable data models that serve as a single source of truth across the organization. Dataflows handle ETL without leaving the Power BI environment.
-
Massive Community and Resources — The largest BI user community means abundant tutorials, templates, forums, and third-party training. Finding help for Power BI problems is easier than for any other tool on this list.
Pricing & Plans
- Power BI Free: Free — individual use
- Power BI Pro: $14/user/month, paid yearly
- Power BI Premium Per User (PPU): $24/user/month, paid yearly
- Power BI Embedded: Variable pricing
TCO Note: Copilot for Power BI still requires organizational capacity — a paid Fabric capacity (F2 or higher) or Power BI Premium capacity — so Pro or PPU licensing alone is not enough for Copilot access.
Limitations
- Copilot requires expensive Fabric capacity ($263/month minimum) that's separate from per-user licensing — the AI headline feature isn't accessible on the standard plans most teams use.
- Copilot struggles with complex data models and doesn't understand your business context — it works well for simple queries but produces unreliable results on multi-table analyses.
- Power BI itself warns "mistakes are possible" on Copilot outputs, which undermines data trustworthiness for decision-making.
- Desktop-first architecture means the web experience feels like a secondary citizen — some features are desktop-only, creating friction for remote teams.
Best For
Power BI fits Microsoft-stack organizations that already have E5 or Fabric licensing and want BI tightly integrated with Teams, SharePoint, and Azure. Not the right fit if you want AI analytics without additional infrastructure investment, don't use the Microsoft ecosystem, or need a web-first collaborative experience.
Get started with Power BI
Omni

Your data team just migrated to Snowflake and needs a BI tool that treats the warehouse as the source of truth — not one that imports data into its own proprietary layer. Omni is built for modern data stack teams that want a semantic modeling layer on top of their cloud warehouse, with AI-powered analysis that respects the data contracts your engineers spent months defining.
Key Features
-
Warehouse-Native Architecture — Core queries run against supported cloud warehouses such as Snowflake, BigQuery, and Databricks. Confirm caching, extracts, telemetry, and regional processing for your deployment rather than assuming no data leaves the warehouse in every feature.
-
Shared Modeling Layer — Define metrics, dimensions, and relationships once in a version-controlled semantic layer. Business users explore data through governed definitions while data engineers maintain control over the logic.
-
AI-Powered Exploration — Generate SQL, suggest visualizations, and surface anomalies using natural language within the governed data model. AI operates within the semantic layer constraints, reducing hallucination risk.
-
Developer-Friendly Workflow — Git integration, CLI tools, and dbt compatibility. Data engineers can manage Omni's modeling layer alongside their existing dbt projects.
Pricing & Plans
- Pricing: Custom — contact sales for a quote
- Free Trial: Available
TCO Note: Omni does not publish pricing. Request a quote that separates licenses, implementation, support, and cloud-warehouse compute rather than estimating cost from competitor positioning.
Limitations
- No published pricing creates friction for teams that need budget approval before evaluating — you're committing to a sales conversation just to learn the cost.
- Predictive analytics and advanced ML capabilities lag behind tools like Tellius and Qlik — Omni is stronger on exploration than forecasting.
- Steep learning curve for users coming from traditional BI tools — the modeling-layer-first approach requires a mental shift.
- Fewer third-party integrations compared to established platforms like Tableau or Power BI.
Best For
Omni fits modern data teams (analytics engineers, dbt users) that want a BI tool designed for the cloud warehouse era with strong governance and version control. Not the right fit if you need self-serve pricing, work with non-warehouse data sources (spreadsheets, APIs), or want a tool that non-technical users can operate without analyst support.
Get started with Omni

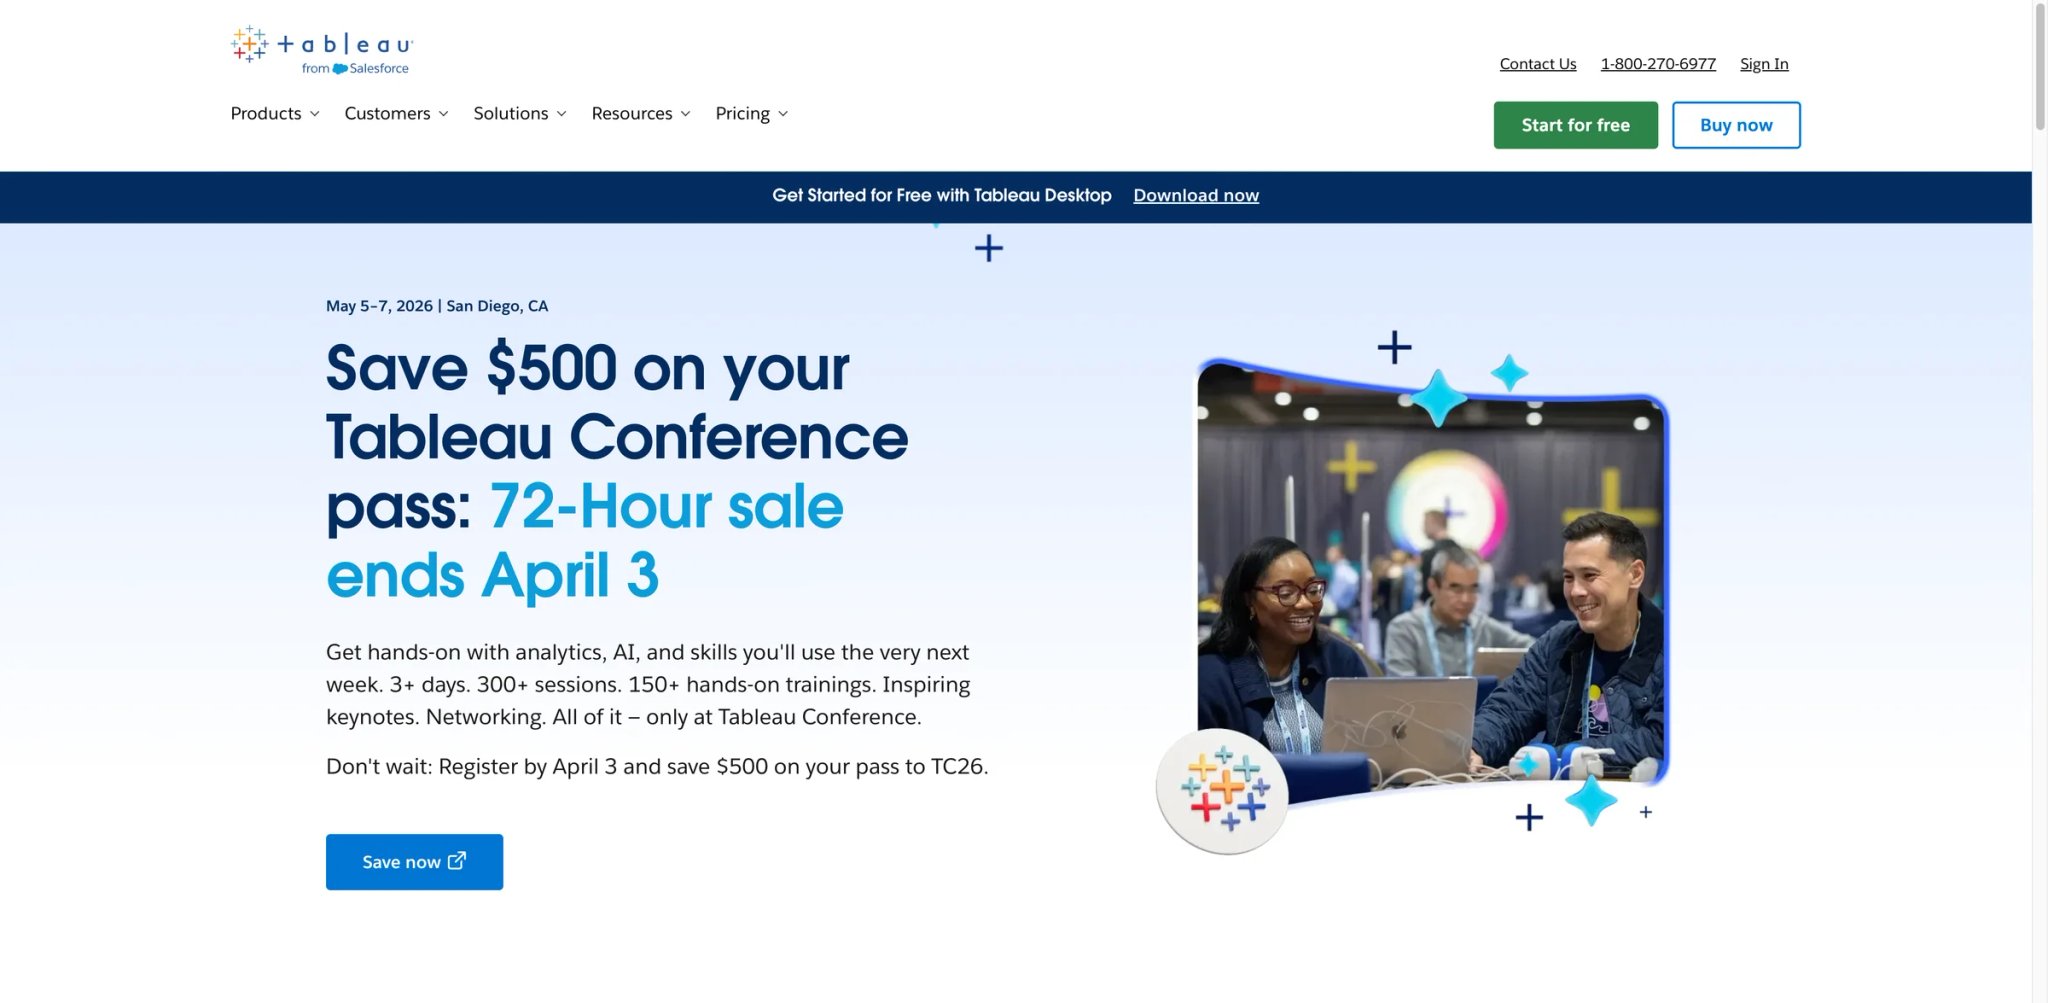
You need to present quarterly results to the board with visualizations that look like they came from a design agency, and no other tool produces charts this polished. Tableau remains the gold standard for data visualization — and with Tableau Pulse and Einstein AI integration, it now adds natural language summaries and automated metric monitoring on top of its legendary charting engine.
Key Features
-
Industry-Leading Visualization Engine — More chart types, customization options, and visual polish than any competitor. Tableau's rendering engine handles geographic maps, complex scatter plots, and multi-layer dashboards that other tools simply can't match at the same fidelity.
-
Tableau Pulse with AI Summaries — Automatically monitors key metrics and generates plain-English summaries of changes, trends, and anomalies. Delivered via email or Slack digest, reducing the need to manually check dashboards.
-
Einstein AI Integration — Predictive analytics, what-if analysis, and natural language query (Ask Data) powered by Salesforce Einstein. Extends Tableau from descriptive to predictive analytics.
-
Largest Ecosystem — Tableau Public for community vizzes, Tableau Exchange for pre-built connectors and accelerators, and the most extensive training and certification program in the BI industry.
Pricing & Plans
- Tableau Viewer: $15/user/month — view and interact with dashboards
- Tableau Explorer: $42/user/month — create and modify workbooks
- Tableau Creator: $75/user/month — full authoring with Prep Builder and Data Management
- Enterprise: Custom pricing
TCO Note: Tableau cost depends on the mix of Creator, Explorer, and Viewer roles plus hosting, data preparation, and support. Price the actual role mix instead of applying one seat rate across the organization.
Limitations
- Per-role licensing can escalate at scale, and hosting or data-preparation costs sit outside the headline seat price
- Customer support quality has declined since the Salesforce acquisition — Reddit users report that community forums are now the primary support channel for non-enterprise customers.
- No real-time collaboration — multiple users cannot edit the same dashboard simultaneously, and there's no native version control or git integration.
- Steep learning curve — business users often remain fully dependent on data teams for anything beyond basic chart modifications.
Best For
Tableau fits organizations that prioritize visualization quality and have the budget and technical staff to support it. Not the right fit if you're budget-constrained, need real-time collaboration, or want non-technical users to build their own reports without training.
Get started with Tableau
Domo
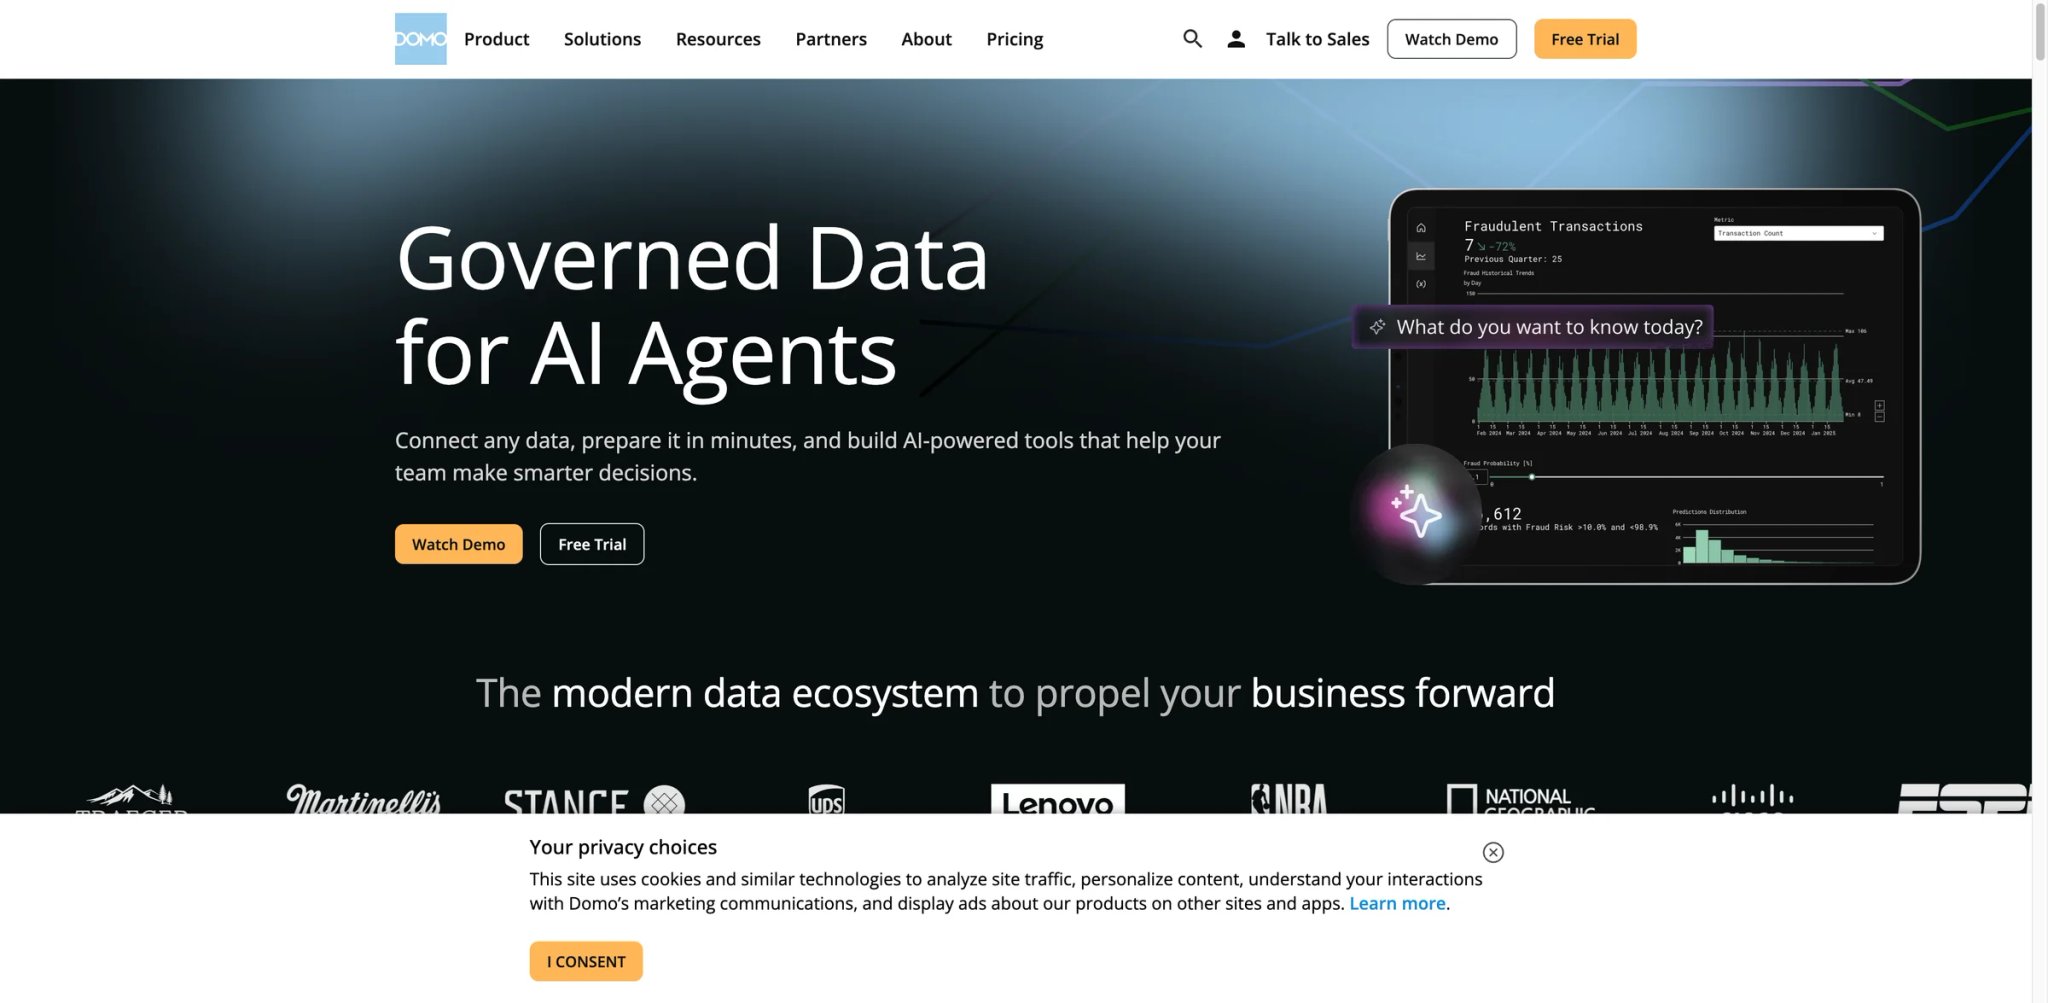
Your organization needs one platform that handles data integration, warehousing, visualization, and embedded analytics — and you don't want to stitch together five separate tools. Domo is a full-stack cloud BI platform that covers the entire analytics pipeline from ingestion to dashboard delivery, with AI and ML capabilities built into each layer.
Key Features
-
Full-Stack Analytics Platform — Data connectors (1,000+), data warehouse, ETL pipelines, visualization, and embedded analytics in a single platform. Reduces the tool sprawl that comes from combining separate ETL, warehouse, and BI solutions.
-
AI/ML Integration — Build and deploy ML models within the platform using AutoML, then surface predictions directly in dashboards. Data scientists and analysts work in the same environment rather than throwing models over the wall.
-
Mobile-First Dashboards — Dashboards are designed for mobile viewing from the start, with native iOS and Android apps that support offline access and push notifications.
-
Embedded Analytics — White-label Domo dashboards into your product with full API control. One of the more mature embedded analytics offerings in the market.
Pricing & Plans
- Pricing: Custom — consumption-based pricing, quote required
- Free Trial: 30-day trial, no credit card required
TCO Note: Domo's official pricing page emphasizes custom consumption-based pricing but does not publish specific credit conversions. Confirm usage definitions, connector costs, caps, overages, and renewal protections in the contract.
Limitations
- Consumption-based custom pricing makes renewal protections and usage definitions important contract terms
- Dataset loading can take hours for large imports with no clear resolution from support, creating bottlenecks during critical reporting periods.
- The interface requires significant learning time despite marketing as "user-friendly" — most reviewers say it takes weeks to become productive.
- No easy out-of-box option for incremental data loading, which creates inefficiency for datasets that update frequently.
Best For
Domo fits mid-market and enterprise organizations that want a single-vendor analytics stack and are willing to negotiate aggressively on contract terms. Not the right fit if you're price-sensitive, need transparent and predictable billing, or prefer best-of-breed tools over an integrated platform.
Get started with Domo
Rows
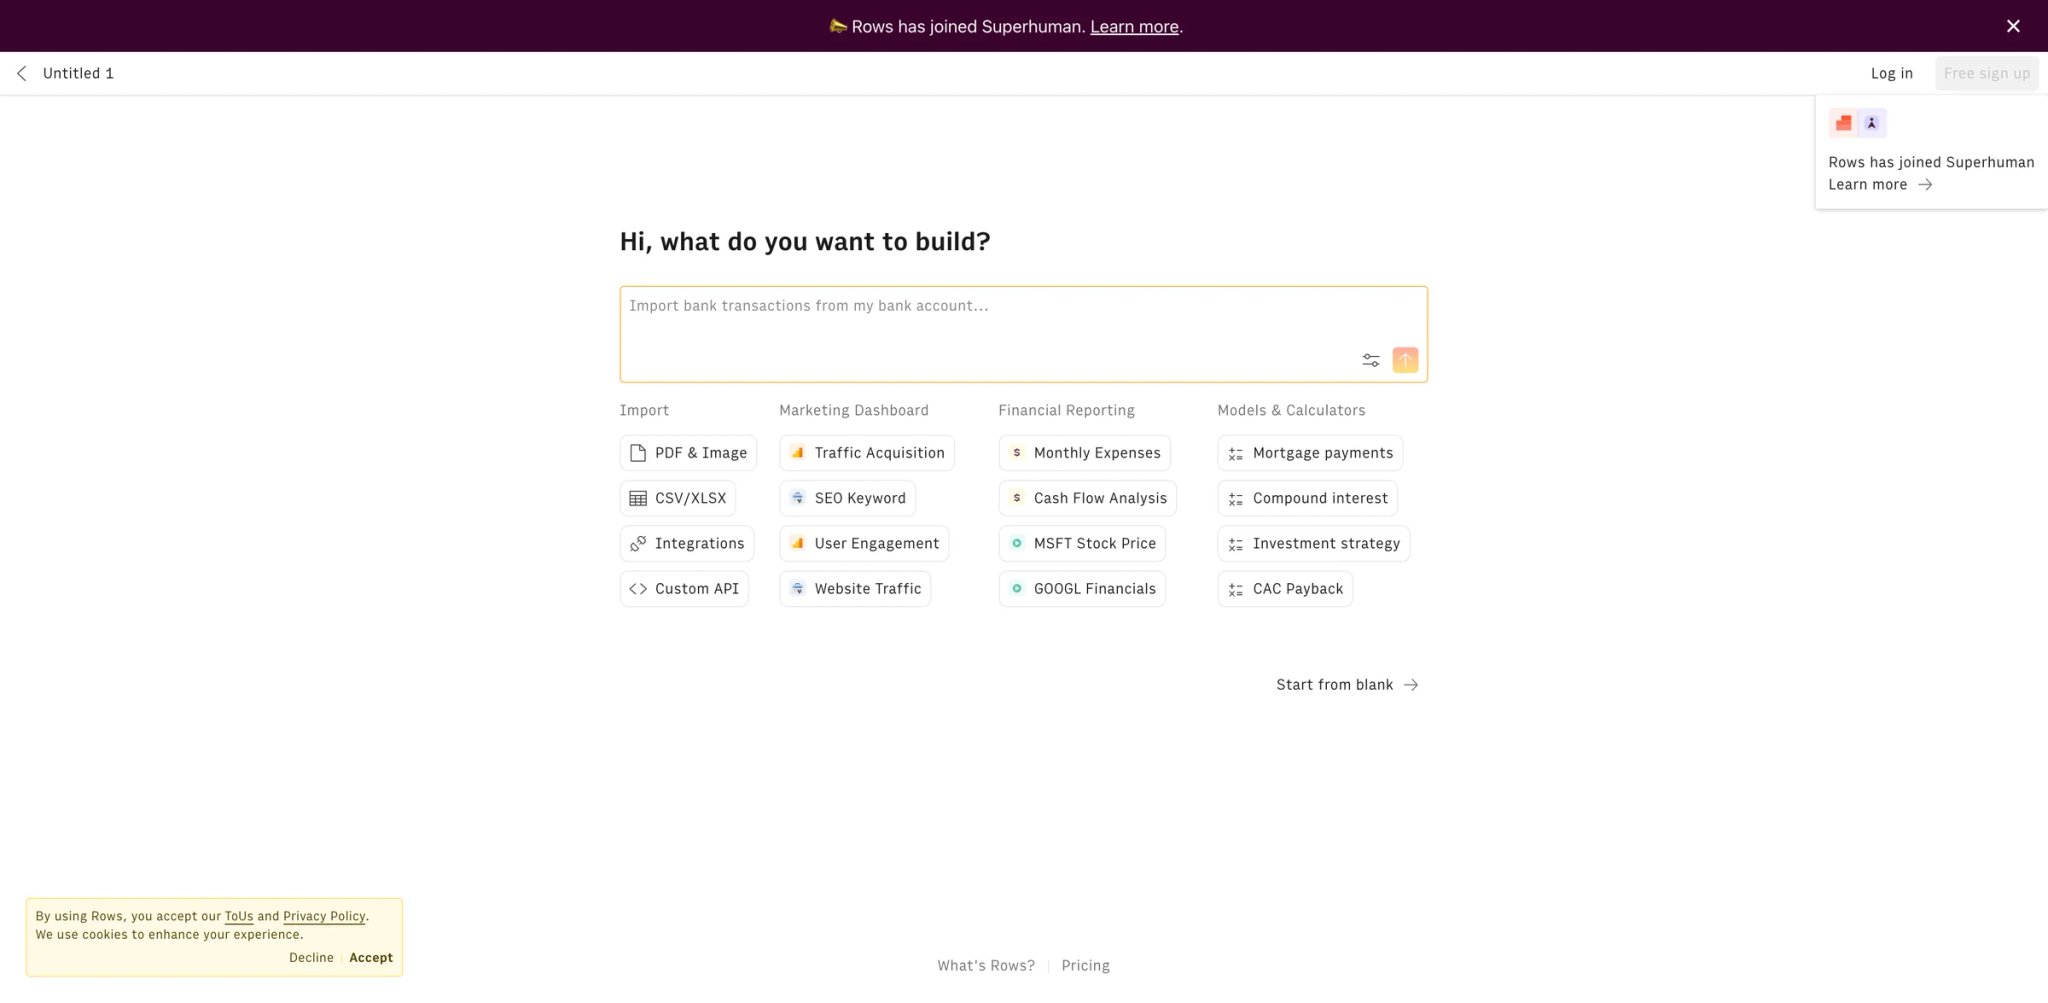
Your marketing team needs to analyze campaign data every week but refuses to learn a BI tool — they live in spreadsheets. Rows gives them what they want: a familiar spreadsheet interface with an AI analyst built in that can summarize data, generate charts, and enrich cells with live data from APIs, all without leaving the tab-and-cell environment they already know.
Key Features
-
AI Analyst in a Spreadsheet — Ask questions about your data in natural language and get charts, summaries, and statistical analysis directly in the spreadsheet. The AI reads your data context (headers, ranges, patterns) and generates relevant insights without requiring formulas.
-
Built-In Data Connectors — Pull live data from Google Analytics, HubSpot, Stripe, LinkedIn, Twitter, and 50+ services directly into cells. No Zapier or middleware required — the data updates on schedule or on demand.
-
Data Enrichment — Enrich contact lists with company data, validate emails, and pull financial data using built-in integrations. Turns a static spreadsheet into a dynamic research tool.
-
Shareable Reports — Turn any spreadsheet into a published report or dashboard with one click. Viewers see a clean, formatted page — not the raw spreadsheet.
Pricing & Plans
- Free: $0 — unlimited spreadsheets, 5 AI tasks/month, manual data-table imports, up to 3 guests
- Plus: $8/month per user ($6/month per user billed annually) — 200 AI tasks/month, daily automation, up to 10 guests
- Pro: $79/month + $8/month per user ($59/month + $6/month per user billed annually) — 1,000 AI tasks/month, minute-level automation, up to 200 guests, unbranded embeds
- Enterprise: Custom — advanced API endpoints, custom AI models/integrations, SAML SSO, dedicated CS manager
TCO Note: Rows pricing is seat-based for Plus and base-plus-seat for Pro, with AI tasks and automation limits tied to plan level. The free tier's 5 AI tasks/month is enough to test, not enough for regular use.
Limitations
- AI-generated formulas and analysis still require checking against known totals, schemas, and business rules before use in decisions
- Smaller ecosystem than Excel or Google Sheets — fewer integrations, templates, and community resources.
- Not designed for large-scale enterprise analytics — lacks governance controls, row-level security, and audit trails that larger organizations require.
Pros & Cons
Pros
- Familiar spreadsheet UX with genuinely useful lightweight AI analysis
- Clear current plan matrix with AI task, automation, guest, and embed limits
- Good fit for small operational workflows that do not justify full BI tooling
Cons
- Current paid pricing is higher and more seat-structured than many expect from a spreadsheet tool
- AI task caps and automation limits make scaling less predictable for active teams
- Not designed for governed enterprise analytics or large semantic-model workflows
Best For
Rows fits small teams and individual analysts who want AI-enhanced analysis in a familiar spreadsheet format without the complexity of a full BI platform. Not the right fit if you need enterprise governance, work with datasets over 100K rows regularly, or require advanced statistical modeling.
For a broader comparison of AI-enhanced spreadsheet tools, see our best AI spreadsheet tools category.
Get started with Rows
Best AI Data Analysis Tools by Use Case
Different analytics needs call for different tools. Here's how the 13 platforms map to specific use cases:
For Non-Technical Business Users Who Need Quick Answers
- Julius AI — Fastest path from data upload to insight. No SQL required, no onboarding friction. Best for ad-hoc questions on files under 50MB.
- Rows — Familiar spreadsheet interface with AI built in. Best for teams that refuse to leave the spreadsheet paradigm.
- Zoho Analytics — Ask Zia handles routine questions well, and the Zoho ecosystem integration means data is already connected.
For Data Teams Running Cloud Warehouses
- Hex — Best for teams that work in SQL and Python and want collaborative notebooks with AI assist.
- Sigma — Best for organizations that want to give spreadsheet-literate analysts direct warehouse access.
- Omni — Best for dbt-heavy teams that want BI with a proper semantic layer and version control.
For Enterprise Analytics with Governance Requirements
- ThoughtSpot — Best for large organizations that want business-user self-service at scale with AI search.
- Qlik — Best for complex multi-source environments that need associative exploration and compliance controls.
- Tableau — Best for organizations that prioritize visualization quality and have mature data teams.
- Domo — Best for organizations wanting a single-vendor stack from ingestion to embedded analytics.
For Budget-Conscious Teams
- Metabase — Best free option. Self-host the open-source version for $0 in licensing. Cloud starts at $100/month.
- Zoho Analytics — Best affordable paid option at $25/month for 2 users. Genuine free tier with 10K rows.
- Rows — Free tier includes 5 AI tasks/month. Best for individuals and very small teams.
For Diagnostic Analytics (Understanding "Why")
- Tellius — Purpose-built for guided and automated root-cause investigation when explaining why a metric changed is the primary workflow.
- ThoughtSpot — Spotter AI Agent proactively surfaces anomalies and suggests investigation paths.
If your team also needs AI data visualization tools for more specialized charting, or AI data science tools for advanced modeling and ML workflows, those categories cover the adjacent parts of the analytics stack.
How to Choose the Right AI Data Analysis Tool
Start with three questions that eliminate most wrong choices:
1. Who are the primary users?
- Non-technical business users → Julius AI, Rows, or Zoho Analytics (low learning curve, no SQL required)
- SQL-literate analysts → Hex, Sigma, or Metabase (code-friendly interfaces with AI assist)
- Enterprise teams with mixed skill levels → ThoughtSpot, Qlik, or Power BI (self-service with governance guardrails)
2. Where does your data live?
- Cloud warehouse (Snowflake, BigQuery, Databricks) → Sigma, Hex, Omni, or ThoughtSpot (warehouse-native, no data extraction)
- Microsoft Azure/SQL Server → Power BI (deepest native integration)
- Zoho suite → Zoho Analytics (zero-config data flow)
- Spreadsheets and CSV files → Julius AI or Rows (file-based analysis)
- Mixed sources including legacy systems → Qlik or Domo (broadest connector ecosystem)
3. What procurement path can you support?
- Self-serve or small pilot → Metabase, Rows, Julius AI, or Zoho Analytics
- Data-team purchase with warehouse access → Hex, Sigma, Metabase Cloud, or Omni
- Enterprise procurement with security review and proof of concept → ThoughtSpot, Qlik, Tableau, Tellius, Power BI, or Domo
Red Flags to Watch For
- "AI-powered" without specifics — Ask exactly which features use AI and which are traditional. Some vendors rebrand existing features as "AI" without adding new capabilities.
- Consumption-based pricing without caps — Domo's credit model and Sigma's warehouse compute costs can spiral. Demand a cost calculator or cap before signing.
- No self-serve trial — If you can't evaluate the tool without a sales call (Tellius, Omni, Domo), factor in the evaluation cost of your team's time.
- Per-query AI pricing — ThoughtSpot and some Power BI features charge per AI interaction. Model your team's expected usage before committing.
Frequently Asked Questions
What is an AI data analysis tool?
Can AI data analysis tools replace human analysts?
Are free AI data analysis tools good enough for business use?
How accurate are natural language queries in these tools?
What hidden costs should I watch for in AI analytics platforms?
How do I evaluate an AI analytics tool before buying?
Which AI data analysis tool is best for small businesses?
Should I choose a specialized AI analytics tool or an all-in-one platform?
Get ToolWorthy Weekly
New AI tools, practical guides, and selected AI signals in one weekly brief.
Related Posts
- 10 Best AI Dashboard Generators 2026 - BI, Agents, and Cost
Compare AI dashboard generators for governed BI, natural-language analytics, data apps, embedded reporting, pricing clarity, and rollout risk.
For AI tool founders
Built a tool that belongs in this decision set?
Request an editorial evaluation for possible inclusion in ToolWorthy.
Submit your tool for reviewPaid submission does not guarantee a ranking, recommendation, inclusion, or editorial outcome.